
Correlation Breakdown: Why Diversification Can Fail During Market Stress
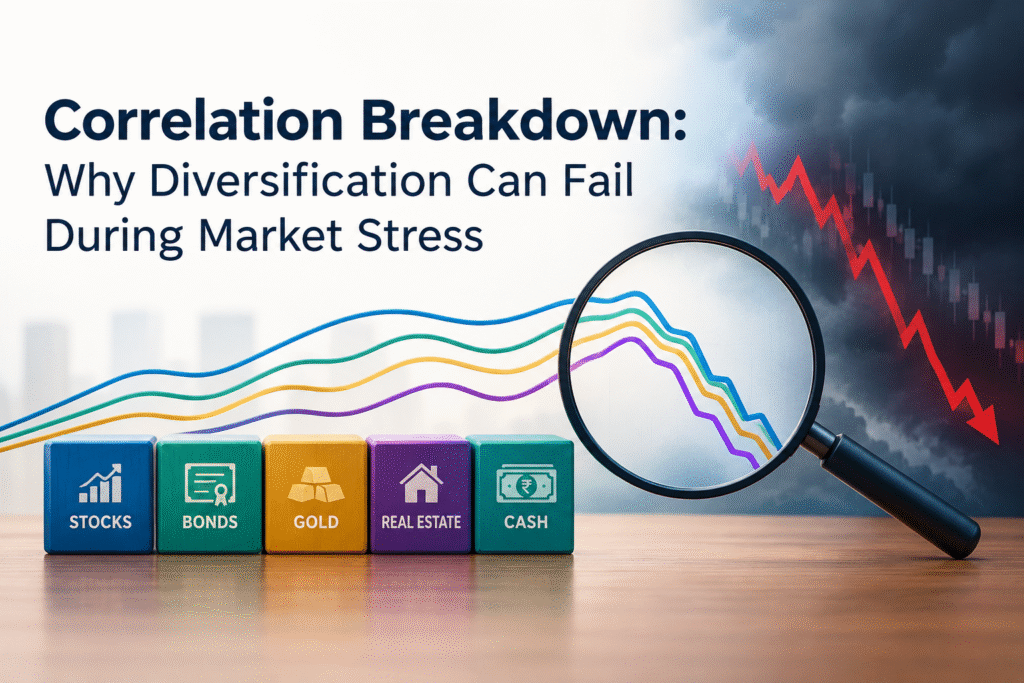
Every investor has heard it a hundred times: don’t put all your eggs in one basket. Spread your money across stocks, bonds, gold and property, and when one falls, another will hold up.
That advice is sound most of the time. The trouble is that “most of the time” does not include the weeks when you need it most. In a real market panic, assets that normally move in different directions can start falling together. This is called correlation breakdown, and it is the reason a well-diversified portfolio can still show a painful loss in a crisis.
This guide explains what correlation breakdown means in plain language, why it happens, how it showed up in 2008, in March 2020 and in 2022, and what a retail investor in India can do about it.
What Is Correlation Breakdown?
Correlation breakdown is the tendency of different asset classes to move more closely together during periods of market stress than they do in calm markets. Some writers call the same thing correlation clustering or correlation spikes.
Diversification works because of low correlation. If two assets rarely fall at the same time, holding both lowers the swings in your total portfolio. If they begin to fall together, the benefit shrinks or disappears.
The phrase “breakdown” is a little misleading. The relationship between the assets has not really broken. It has shifted. In a panic, the same forces start pushing nearly everything in one direction, and the quiet-period numbers stop being a useful guide.
A Quick Refresher on Correlation and Diversification
The correlation coefficient is a number between -1 and +1 that shows how two investments move relative to each other.
- +1 means they move in perfect step.
- 0 means there is no reliable link between them.
- -1 means they move in exactly opposite directions.
Most portfolio planning, including Modern Portfolio Theory, uses an average of past correlations to decide how much of each asset to hold. The weakness is easy to spot. An average taken across many calm years tells you little about how assets behave on the worst five days of a decade.
One published guide on crisis correlations puts it this way: pairs that look loosely connected in normal times can jump to a range of roughly 0.5 to 0.9 during stress. Another study that split markets into regimes found large-cap stock and bond correlations swinging from about -0.37 in good regimes to about +0.40 under pressure. The sign itself changed.
Why Correlations Rise During Market Stress
There is no single cause. Four forces usually work together.
1. Forced selling and the hunt for cash
When losses mount, investors with margin calls, redemption requests or loan obligations need cash fast. They do not sell only what they want to sell. They sell what they can sell. That often means liquid, profitable holdings, including the very assets that were supposed to be the safe ones. The selling itself pulls prices down across the board.
2. One shared macro shock
In a calm market, stocks respond to company earnings, bonds respond to interest rates, and gold responds to currency worries. In a crisis, one big story takes over: a banking failure, a pandemic, a surge in inflation. When a single factor drives everything, separate assets start behaving like one.
3. Risk-off behaviour
During stress, investors tend to cut risk broadly rather than choosing carefully. They do not stop to ask whether a particular mid-cap fund or corporate bond is fundamentally sound. They reduce exposure first and sort out the details later.
4. Global money moves together
Foreign portfolio investors hold Indian equities alongside shares in many other countries. When their global portfolio takes a hit, they may sell in India for reasons that have nothing to do with Indian companies. This is one reason Indian markets often fall sharply on days when the bad news is coming from somewhere else entirely.
Three Times Diversification Let Investors Down
2008: The Global Financial Crisis
In 2008, almost every risky asset fell together. Global equities, emerging market shares, commodities, real estate and lower-rated bonds all dropped sharply and at the same time. The Nifty 50 lost more than half its value from its January 2008 high. Investors who held Indian stocks, mid-caps and real estate funds as “different” bets found that they were largely the same bet on risk appetite.
March 2020: The COVID Crash and the Franklin Templeton Shock
The Nifty 50 fell roughly 38 percent from its January 2020 peak to the March low. Most investors were prepared for equities to fall. What many did not expect was trouble in their debt funds.
On 23 April 2020, Franklin Templeton Mutual Fund announced it was winding up six debt schemes, citing a lack of liquidity in the bond market and heavy redemptions. One case study estimates the assets in those schemes at around ₹28,000 crore. The Credit Risk Fund alone had about 88 percent of its money in corporate bonds rated AA or below as of 31 March 2020.
Here is the diversification lesson. Many investors held equity funds for growth and debt funds for safety. But the debt funds in question were chasing higher yields through lower-rated paper. When panic hit, those bonds became very hard to sell. A debt fund is only as safe as the bonds inside it, and in a liquidity squeeze, credit risk and equity risk show up together.
On the day after the announcement, the Nifty 50 closed down 1.71 percent at 9,154.40, partly on fears of fund redemptions. MCX gold futures, meanwhile, rose nearly 1 percent. Gold did its job on that particular day, though not in every week of that crash.
2022: When Bonds Stopped Protecting Stocks
For about two decades, government bonds were the standard cushion for stock market losses. Stocks fell, yields dropped, bond prices rose, and the loss was softened. This is why the classic 60/40 portfolio (60 percent stocks, 40 percent bonds) became so popular.
In 2022, inflation surged and central banks raised rates quickly. Bonds and stocks both fell at once. US yields rose by around three percentage points in some stretches of the year, which hurt bond prices badly. Commentators described 2022 as one of the worst years for the 60/40 mix in about half a century. Some called it “the everything bear market.”
The lesson is subtle. Stock and bond correlation is not fixed. It depends on what is driving the market. When a growth scare drives stocks lower, bonds usually rally. When inflation drives stocks lower, bonds fall alongside them.
A Simple Example: What Rising Correlation Does to Portfolio Risk
Take a portfolio with two assets, 50 percent each. Assume each has an annual volatility (a measure of how much it swings) of 20 percent.
| Correlation between the two assets | Portfolio volatility |
|---|---|
| 0.2 (calm market) | about 15.5% |
| 0.9 (market panic) | about 19.5% |
| 1.0 (perfect link) | 20.0% |
At a correlation of 0.2, spreading your money cuts risk by almost a quarter compared with holding either asset alone. At 0.9, nearly all of that benefit is gone. Nothing about the assets themselves changed. Only the relationship between them did.
This is the core problem. The risk number you computed in a quiet year understates the risk you will actually experience in a bad one.
Which Assets Tend to Hold Up Better?
No asset is guaranteed to protect you. But history gives some useful patterns.
| Asset type | Usual behaviour in calm markets | Behaviour during stress | Main caution |
|---|---|---|---|
| Equities (large, mid, small cap) | Moderate links between segments | Move together, with small caps usually falling hardest | Little protection inside the equity bucket |
| Government bonds (G-secs) | Low or negative link to stocks | Often protective in growth scares, weaker in inflation shocks | Interest rate risk |
| Corporate bonds and credit risk funds | Moderate link to stocks | Often fall with equities and can become hard to sell | Credit and liquidity risk |
| Gold | Low link to stocks | Often steady or rising, but can dip briefly in a cash scramble | Returns can be flat for years |
| Liquid, overnight and banking and PSU debt funds | Very low link | Usually stable | Low returns |
| Real estate | Slow-moving, low reported link | Hard to sell quickly, prices adjust slowly | Illiquid and large ticket size |
| Cash | None | Holds its value, loses to inflation over time | Opportunity cost |
Notice that real estate looks safe partly because it is priced rarely. Slow price updates can hide the true correlation. That does not make it a hedge. It only makes the loss harder to see.
How to Build a Portfolio That Survives Correlation Breakdown
You cannot remove the risk. You can reduce its damage with a few practical steps.
Step 1: Count your real risk sources, not your fund count
Owning six equity mutual funds is not six-way diversification. A large-cap fund, a flexi-cap fund and a mid-cap fund can fall by similar amounts in the same month. Look at the asset classes underneath, and check the overlap in holdings.
Step 2: Keep a true safe bucket
Put your emergency money and short-term goals in assets where safety is clear: savings accounts, liquid funds, overnight funds, and banking and PSU debt funds with high credit quality. Do not chase an extra 1 percent of yield there. The Franklin Templeton episode showed what that choice can cost.
Step 3: Check the quality inside your debt funds
Read the factsheet. Look at the credit rating mix, the average maturity and the largest holdings. If a large share sits in AA or lower paper, you are taking credit risk, not buying safety.
Step 4: Hold some gold, and keep it modest
Gold has often kept some of its diversification value in past crises, though not perfectly. A small allocation can help. A large one introduces its own risks, since gold can go through long flat periods.
Step 5: Do not rely on one hedge
The bond hedge worked for years and then failed in 2022. Gold has dipped in short panics. Cash loses to inflation. A spread of hedges, each with a different weakness, holds up better than one favourite.
Step 6: Rebalance on rules, not on emotion
Set a target mix, such as 60 percent equity, 25 percent debt, 10 percent gold and 5 percent cash. Check it once or twice a year, or when any asset drifts by a fixed margin, say 5 percentage points. Rebalancing forces you to buy what has fallen and trim what has risen, which is hard to do on instinct.
Step 7: Consider multi asset allocation funds
SEBI’s rules for multi asset allocation funds require exposure to at least three asset classes. These funds do the rebalancing for you inside one product. They are not crash-proof, and the asset classes can still fall together, but they remove the temptation to tinker.
Step 8: Size your equity exposure to what you can hold through a fall
The best defence against correlation breakdown is not a clever hedge. It is owning an amount of risk you can live with when everything is red. Investors who sell in a panic turn a temporary drop into a permanent loss.
Common Mistakes to Avoid
- Judging diversification by calm-year numbers. Past correlation figures understate crisis risk.
- Treating “debt fund” as a synonym for “safe.” Credit risk and liquidity risk are real.
- Owning many funds that hold the same shares. Check overlap before adding another scheme.
- Assuming bonds will always hedge stocks. The relationship depends on what is driving the market.
- Selling at the bottom to “stop the pain.” Selling during a panic usually locks in the loss.
- Over-hedging in good times. Too much protection can drag returns for years.
Key Takeaways
- Correlation breakdown means assets that move independently in calm markets tend to fall together in a crisis.
- It happens because of forced selling, a shared macro shock, broad risk-off behaviour and global money flows.
- 2008, March 2020 and 2022 each showed it in a different form.
- Diversification still works. It just works less well than the averages suggest, and it works best when you spread across different sources of risk rather than different names.
- Keep a clearly safe bucket, check the quality of your debt funds, rebalance on rules, and own only as much equity as you can hold through a bad year.
Frequently Asked Questions
What is correlation breakdown in investing?
Correlation breakdown is when different assets, which usually move in different directions, start moving together during market stress. It reduces the protection that diversification normally gives, because losses arrive in several parts of the portfolio at once.
Why does diversification fail during a market crash?
Diversification fails in a crash because investors sell broadly to raise cash and cut risk, and because one big shock, such as a pandemic or an inflation surge, drives many assets at the same time. These forces push correlations toward 1.
Does diversification still work?
Yes. Diversification still reduces risk over time and across most market conditions. It is not a guarantee against loss in a severe panic. Think of it as lowering the size of the fall, not preventing it.
Do bonds protect a portfolio when stocks fall?
Sometimes. Government bonds often rise when stocks fall because of a growth scare. They can fall together with stocks when inflation and rising interest rates are the cause, as in 2022. Lower-rated corporate bonds often fall with equities in any crisis.
Is gold a good hedge against market stress?
Gold has often held up or risen in past crises, which makes it a useful small allocation. It can also dip briefly when investors sell anything liquid, and it can go flat for years. It helps, but it is not a complete hedge.
What happened to debt funds in March 2020 in India?
Heavy redemptions and a lack of buyers in the corporate bond market created a liquidity squeeze. On 23 April 2020, Franklin Templeton Mutual Fund wound up six debt schemes that held many lower-rated bonds. The episode showed that credit and liquidity risk can hit debt funds when equities are falling.
How can I check whether my portfolio is really diversified?
List the underlying asset classes, check the overlap between your equity funds, read the credit quality of your debt funds, and ask what would happen to each holding if cash became scarce. If most answers are “it would fall,” your portfolio is more concentrated than it looks.
What is a rolling correlation?
A rolling correlation measures the link between two assets over a moving window, such as the last 60 days or 12 months. It shows how the relationship changes over time and is a better guide than a single long-term average.
Are multi asset allocation funds safe from correlation breakdown?
No fund is. Multi asset funds spread money across at least three asset classes and rebalance automatically, which helps with discipline. They can still fall when all asset classes drop together.
This article is for general education only and is not investment advice. Please consider your goals and risk tolerance, and consult a SEBI-registered advisor before making decisions.