
Quality of Earnings: Detecting When Reported Profits Don’t Translate Into Cash
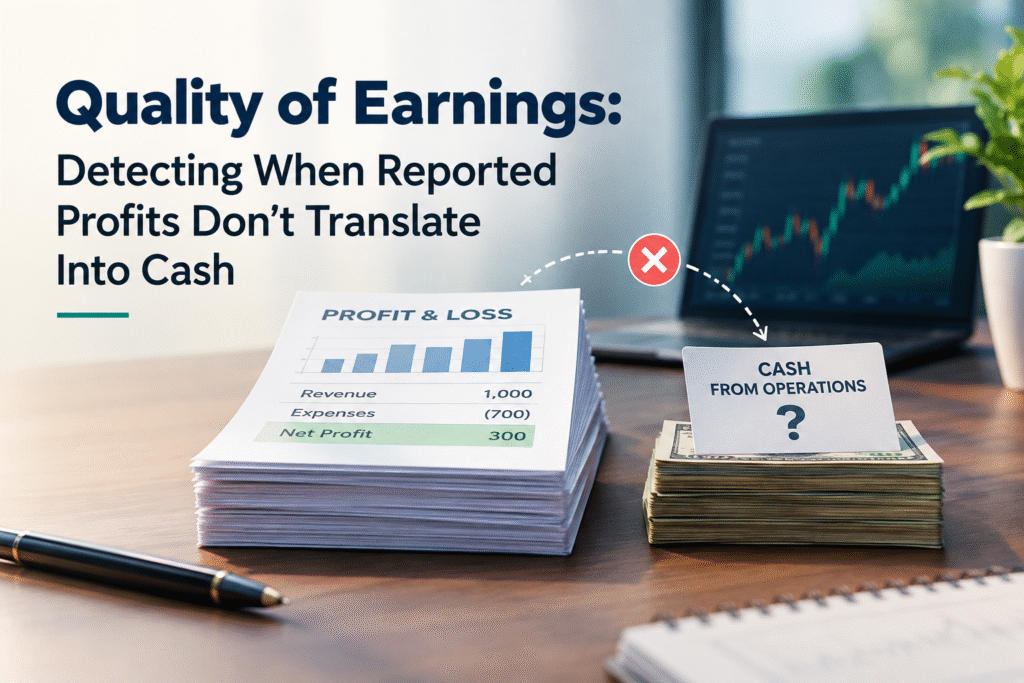
Quality of earnings is a way of checking whether the profit a company reports is real, repeatable and backed by cash. A company can show a rising profit after tax (PAT) every year and still run short of money to pay suppliers, repay loans or declare dividends. When reported profit does not turn into cash, the profit is of poor quality, and the share price usually pays for it sooner or later.
This guide explains quality of earnings analysis in plain language for Indian retail investors. You will learn the difference between profit and cash, the ratios that expose the gap, the warning signs to look for in a company’s financial statements, and a simple routine you can follow before buying any stock.
What Is Quality of Earnings?
Quality of earnings, also called earnings quality, tells you how much of a company’s net profit comes from its core business, how likely that profit is to repeat next year, and how much of it has actually reached the bank account.
High-quality earnings come from normal business operations. They are collected in cash within a reasonable time, and they are not pushed up by one-time gains or aggressive accounting choices. Low-quality earnings sit on paper. They look fine in the profit and loss statement, but in the balance sheet they show up as unpaid customer bills, unsold stock or accounting adjustments.
The same term is used in mergers and acquisitions, where a buyer hires accountants to prepare a quality of earnings report before purchasing a business. A stock investor is asking the same question, only on a smaller scale and with public numbers.
Why Reported Profit and Cash Are Not the Same Thing
Indian listed companies follow accrual accounting under Ind AS. Revenue is recorded when it is earned, as per Ind AS 115, and not when the money arrives. Expenses are recorded when they are incurred, and not when they are paid. This is a sensible system, but it creates a gap between profit and cash.
Suppose a company sells goods worth ₹50 crore to a dealer on 120 days of credit. The full ₹50 crore goes into revenue today. The cash may arrive four months later, or it may never arrive. Profit goes up. Cash does not.
The cash flow statement, prepared under Ind AS 7, closes that gap. Most Indian companies use the indirect method. It starts with net profit, adds back non-cash charges such as depreciation, and then adjusts for changes in receivables, inventory and payables. The result is cash flow from operating activities, usually written as CFO or OCF. Because CFO is much harder to manipulate than net profit, many analysts treat it as the cleaner measure of how a business is really doing.
A Simple Example: Two Companies, Same Profit
Take two companies that both report a PAT of ₹100 crore and depreciation of ₹15 crore.
Company A collects its dues on time and keeps inventory steady. Its operating cash flow comes to about ₹110 crore.
Company B grew its sales by offering longer credit to customers and by stocking up on goods. Its receivables rose by ₹60 crore and its inventory rose by ₹25 crore. Its operating cash flow works out to ₹100 crore plus ₹15 crore, minus ₹60 crore, minus ₹25 crore, which is ₹30 crore.
On the income statement the two companies look the same. In real life, Company A has ₹110 crore to spend and Company B has ₹30 crore. If Company B’s customers pay late or default, the receivables will have to be written off, and profit that was already counted will be reversed.
Key Ratios to Detect Poor Quality of Earnings
No single number gives the full answer. Use these ratios together, and always look at several years, not one.
1. CFO to PAT Ratio (Operating Cash Flow to Net Profit)
CFO to PAT = Cash flow from operations ÷ Profit after tax
This is the first check to run. A ratio above 1 means profit is backed by cash. A ratio that stays below about 0.7 for several years in a row is widely treated as a warning sign. One weak year can happen to any company, so the pattern matters more than a single reading.
2. Accrual Ratio
Accrual ratio = (Net profit minus Operating cash flow) ÷ Average total assets
This ratio shows how much of the profit is not supported by cash. A high positive number means profit is running ahead of cash, which is a warning sign. A negative number means the company is bringing in more cash than its profit suggests, which is a good thing. Some stock research websites use free cash flow in place of operating cash flow in this formula, so check which version is being used before you compare numbers across sources.
3. CFO to EBITDA
Dividing operating cash flow by EBITDA shows how much of the operating profit is turning into cash. A figure close to 1 over many years points to clean earnings with very little accrual distortion. Since tax is paid out of CFO, a figure a little below 1 is common. A figure that keeps falling year after year is the thing to watch.
4. Free Cash Flow and FCF to PAT
Free cash flow (FCF) = Cash flow from operations minus Capital expenditure
FCF is the money left after the company has paid for the plants, machines and projects it needs to keep running and growing. It is the cash that can actually be used to repay debt, pay dividends or buy back shares. If a company reports growing profit year after year and its FCF is negative year after year, the profit is not reaching shareholders. Our article on free cash flow vs accounting profit covers this in more detail.
5. Debtor Days, Inventory Days and Payable Days
These three numbers explain most of the gap between profit and cash.
- Debtor days = Trade receivables ÷ Revenue × 365. If sales grow 10 percent and receivables grow 40 percent, the company is either selling on easier credit or struggling to collect.
- Inventory days = Inventory ÷ Cost of goods sold × 365. Rising inventory days can mean slowing demand or stock that may have to be written down later.
- Payable days = Trade payables ÷ Cost of goods sold × 365. A company can make its CFO look better for a while by delaying payments to suppliers, but the benefit disappears when the payments catch up.
Combine them into the cash conversion cycle: debtor days plus inventory days minus payable days. A cycle that keeps getting longer means more and more of the company’s profit is stuck in working capital.
6. Five-Year and Ten-Year Cumulative CFO vs Cumulative PAT
One year can mislead, so add up the numbers over five or ten years. A healthy business shows cumulative CFO that is close to or above cumulative PAT. If a company reported ₹2,000 crore of profit over ten years and generated only ₹600 crore of operating cash, you should ask where the rest went.
Red Flags in Financial Statements
A weak CFO to PAT ratio is the symptom. These are some of the causes to look for in the annual report.
- Profit rising while operating cash flow is falling, flat or negative.
- Receivables growing much faster than revenue.
- Inventory piling up faster than sales.
- A big share of profit coming from other income, sale of assets, revaluation gains or exceptional items.
- Costs moved from the profit and loss statement to the balance sheet, such as a steady rise in capital work in progress or intangible assets under development with no matching output.
- Sudden changes in depreciation rates, asset life or revenue recognition policy.
- Large related-party transactions, or loans and advances to group companies.
- Frequent change of statutory auditors, or qualified opinions and emphasis of matter remarks in the audit report.
- Debt that keeps rising only to fund working capital, with interest cost eating into profit.
- Rising promoter pledging of shares, or large contingent liabilities.
- A sharp jump in fourth quarter sales that is followed by a big rise in receivables.
None of these proves wrongdoing on its own. Several of them together, year after year, is a good reason to stay away or to ask more questions.
Real Examples From India
The collapse of Infrastructure Leasing and Financial Services (IL&FS) in 2018 is often cited as an example of poor earnings quality, where reported profits gave little warning of how stretched the group’s cash position was. The Satyam scandal of 2009 is an even starker case, where the company’s reported cash and bank balances turned out to be largely fictitious. In both cases, investors who looked only at the profit and loss statement had little to go on. Investors who compared profit with cash flow, and cash balances with interest income, had more reason to be careful.
On the other side, consumer staples companies such as Hindustan Unilever and Nestlé India have historically been quoted as examples of high earnings quality. Their operating cash flows have generally tracked or exceeded reported profit, their provisions are conservative, and their working capital cycles are tight.
Treat these only as examples of what to look for. Always check the latest numbers yourself before forming a view on any company.
When Low Cash Conversion Is Not a Red Flag
A low CFO to PAT ratio does not always mean trouble. Look at the reason before you judge.
- Fast growth. A company that is expanding quickly has to fund more inventory and more receivables. Cash conversion dips, but it recovers if growth slows and the collections are good.
- Infrastructure and EPC businesses. Projects run for years and bills are raised in stages, so cash comes in lumps.
- Seasonal businesses. Sugar, fertilisers and some consumer companies build stock at certain times of the year and the ratio swings with the season.
- Banks and NBFCs. Loans given and deposits taken sit inside operating activities, so the CFO to PAT ratio tells you very little. Look at gross NPA, provision coverage, credit cost and net interest margin instead.
- One-time working capital build. A new plant or a new distribution network may need a one-time stock build.
The test is whether the gap shrinks over time. A temporary gap with a clear reason is fine. A permanent gap with a vague reason is not.
A Simple Six-Step Routine for Retail Investors
- Open the cash flow statement for the last five to ten years. Free stock screening websites and the annual report on the company’s investor page will both have it.
- Calculate the CFO to PAT ratio for each year and for the cumulative period.
- Check free cash flow. See whether capital spending is eating all the operating cash.
- Compare growth in receivables and inventory with growth in sales.
- Read the notes to accounts and the auditor’s report for related-party dealings, contingent liabilities, changes in accounting policy and any remarks from the auditor.
- Check the share of other income and exceptional items in the profit. Strip them out and see what the core profit looks like.
This takes about twenty minutes per company, and it can save you from a bad investment.
Frequently Asked Questions
What is quality of earnings in simple words?
Quality of earnings tells you how real, repeatable and cash-backed a company’s reported profit is. High-quality earnings come from the core business and turn into cash. Low-quality earnings depend on accounting adjustments, one-time gains or unpaid customer bills.
How do I check whether a company’s profits are backed by cash?
Compare operating cash flow with profit after tax over five to ten years. Then look at free cash flow, debtor days and inventory days. If profit keeps growing but cash flow does not follow, the profit is not fully backed by cash.
What is a good CFO to PAT ratio?
A ratio above 1 is considered healthy, since it means the company generates more cash than it reports as profit. A ratio that stays below about 0.7 for several years is usually treated as a warning sign. Banks, NBFCs and fast-growing or project-based companies need to be judged differently.
Can a company be profitable and still run out of cash?
Yes. If customers pay slowly, inventory piles up, or the company spends heavily on new capacity, it can show a profit and still run short of cash. Many businesses that fail are profitable on paper in the years before they fail.
What is the accrual ratio and how do I read it?
The accrual ratio is net profit minus operating cash flow, divided by average total assets. A high positive ratio means profit is running ahead of cash and is a warning sign. A negative ratio means cash is running ahead of profit, which is a good sign.
Where can I find the cash flow statement of an Indian company?
The cash flow statement is part of the annual report and the quarterly or half-yearly results filed on the NSE and BSE websites. Most stock screening websites also show it in a simple table for the last ten years.
Final Thoughts
Profit is an opinion that depends on accounting choices. Cash is a fact. When you read the financial statements of a company, always ask whether the profit is turning into cash, and whether it is likely to keep doing so.
Start with the CFO to PAT ratio, add free cash flow and working capital days, and read the notes to the accounts. If the profit and the cash agree over many years, you have a business worth studying further. If they do not, you now know what to ask.
Disclaimer: This article is for education only and is not investment advice. Please do your own research or speak to a SEBI-registered investment adviser before you invest.