
Free Cash Flow vs Accounting Profit: What Investors Should Actually Analyse
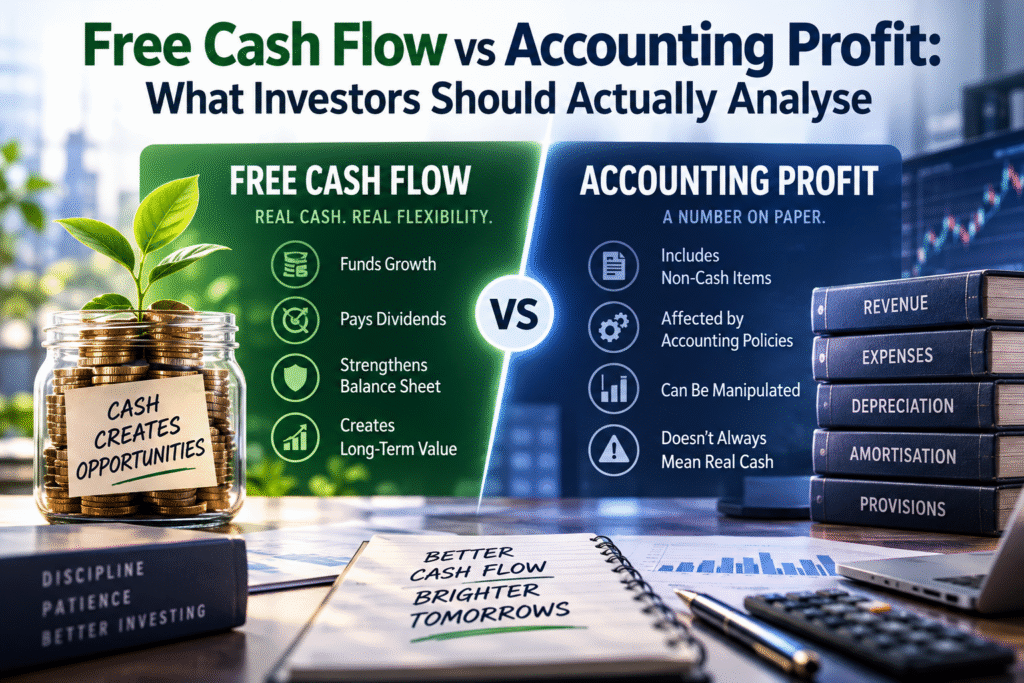
Most investors open a company’s results and look at one line first. It is the profit after tax (PAT), also called net profit. If it has grown, the quarter is called good. If it has fallen, the quarter is called bad.
The trouble is that accounting profit is not the same thing as money in the bank. A company can report a healthy profit year after year and still struggle to pay its bills, repay its loans or give dividends. This is why serious investors compare free cash flow vs accounting profit before they buy a stock.
In this guide, you will learn what free cash flow is, how it differs from net profit, how to calculate it from a cash flow statement, and which ratios tell you whether a company’s earnings are real. The examples are written for Indian retail investors, but the logic works for any market.
What Is Accounting Profit?
Accounting profit is the figure that appears at the bottom of the profit and loss statement. In simple terms, it is revenue minus all expenses, including depreciation, interest and tax. In India, listed companies prepare this statement under Ind AS, and you will see it as “Profit for the period” or PAT.
Accounting profit follows the accrual method. This means a sale is recorded when the sale is made, not when the customer pays. An expense is recorded when it is incurred, not when it is paid.
That is a fair way to measure performance over a period. But it also leaves room for gaps between profit and cash. Here are the most common ones:
- Credit sales: A company sells goods worth ₹100 crore, but the customers have not paid yet. The full ₹100 crore shows up as revenue, while the cash is still pending.
- Depreciation: This is a non-cash expense. It reduces profit, but no money leaves the business that year.
- Inventory build-up: If a company buys raw material and keeps it in the warehouse, cash goes out but profit is not affected until the goods are sold.
- Capital expenditure: Buying a machine or building a plant uses a large amount of cash. Profit only feels it slowly, through depreciation over many years.
So accounting profit tells you whether the business model makes money on paper. It does not tell you how much cash is left for shareholders.
What Is Free Cash Flow?
Free cash flow (FCF) is the cash a company generates from its operations after it has spent money to maintain and grow its asset base. It is the money that is actually free to be used for paying debt, giving dividends, buying back shares or making acquisitions.
Free Cash Flow Formula
The simplest free cash flow formula is:
Free Cash Flow = Operating Cash Flow − Capital Expenditure
You can find both numbers in the cash flow statement in the annual report. Operating cash flow is shown under “Cash flow from operating activities”. Capital expenditure (capex) is usually shown under investing activities, as “Purchase of property, plant and equipment” and similar items.
Some analysts also use the term FCFF (free cash flow to the firm) and FCFE (free cash flow to equity). FCFF is the cash available to all capital providers, both lenders and shareholders. FCFE is what is left for shareholders after the company has paid interest and repaid debt. These two are mainly used in DCF valuation, but for most retail investors, the basic formula above is good enough to start.
A Simple Example
Take a company that reports a net profit of ₹100 crore. In the cash flow statement, you find the following:
- Depreciation (non-cash expense added back): ₹20 crore
- Increase in working capital (receivables and inventory): ₹40 crore
- Capex for the year: ₹60 crore
Operating cash flow = 100 + 20 − 40 = ₹80 crore Free cash flow = 80 − 60 = ₹20 crore
The company earned ₹100 crore on paper, but only ₹20 crore was left over as free cash. That is a conversion of just 20 percent.
Free Cash Flow vs Net Profit: The Key Differences
| Point | Accounting Profit (Net Profit) | Free Cash Flow |
|---|---|---|
| Basis | Accrual accounting | Actual cash movement |
| Found in | Profit and loss statement | Cash flow statement |
| Includes depreciation | Yes, as an expense | No, it is added back |
| Affected by working capital | No | Yes |
| Affected by capex | Only slowly, through depreciation | Immediately |
| Open to accounting choices | More | Less |
| Best used for | Measuring operating performance | Measuring cash available to investors |
Neither number is wrong. They answer two different questions. Net profit asks, “Is this business earning more than it spends?” Free cash flow asks, “After running and growing the business, how much real cash is left for me as an owner?”
Why Free Cash Flow Matters More Than Many Investors Think
1. Cash pays the bills, not profit
Salaries, suppliers, interest and dividends are all paid in cash. A company with high profit and low cash flow may need to borrow to keep running. Over time, this raises its debt and its interest cost.
2. Free cash flow is harder to manipulate
Profit depends on many judgement calls, such as when to recognise revenue, how much to provide for bad debts, and which costs to capitalise. Cash is much harder to dress up. This is why many analysts call FCF a more honest measure of earnings.
3. Dividends and buybacks come from free cash flow
If you are an investor who wants dividends, look at FCF and not just EPS. A company that pays a dividend larger than its free cash flow is either using its cash reserves or borrowing to do it. Neither can go on forever.
4. Valuation methods depend on it
The discounted cash flow (DCF) method, which is the standard way to estimate the intrinsic value of a stock, is built on future free cash flows. If you cannot estimate FCF, you cannot do a proper DCF valuation.
The Ratios That Connect Free Cash Flow and Profit
FCF Conversion Ratio
FCF Conversion = Free Cash Flow ÷ Net Profit
This tells you how much of each rupee of profit turns into free cash. A company that regularly converts 80 to 100 percent or more of its profit into free cash is usually a high-quality business. Asset-light businesses such as FMCG and software companies often show high conversion. Capital-heavy businesses such as steel, power or infrastructure usually show lower numbers, at least during an expansion phase.
Cash Conversion Ratio (Operating Cash Flow to Net Profit)
Operating Cash Flow ÷ Net Profit
This leaves capex out and checks only whether the profit is being collected in cash. If this ratio stays well below 1 for several years, the company may have a problem with collections or inventory.
Accrual Ratio
The accrual ratio is a simple quality of earnings test. It is calculated as:
Accrual Ratio = (Net Profit − Free Cash Flow) ÷ Average Operating Assets
A negative or low number is a good sign, because it means cash is coming in at least as fast as profit. A high positive number means that profit is mostly on paper. Academic studies have found that companies with high accruals tend to show weaker profit growth in later years.
Going back to our example, if the company’s average operating assets are ₹500 crore, the accrual ratio is (100 − 20) ÷ 500 = 0.16. Now compare it with a second company.
Two Companies, Same Profit, Different Quality
| Item (₹ crore) | Company A | Company B |
|---|---|---|
| Net profit | 100 | 100 |
| Depreciation | 20 | 20 |
| Increase in working capital | 40 | 5 |
| Operating cash flow | 80 | 115 |
| Capex | 60 | 30 |
| Free cash flow | 20 | 85 |
| FCF conversion | 20% | 85% |
| Accrual ratio (assuming ₹500 crore of operating assets) | 0.16 | 0.03 |
If you looked only at net profit, you would see two identical companies. Once you look at cash, Company B is far stronger.
FCF Yield and Price to Free Cash Flow
To check whether a stock is cheap or costly on a cash basis, use these two:
FCF Yield = Free Cash Flow ÷ Market Capitalisation Price to Free Cash Flow = Market Capitalisation ÷ Free Cash Flow
If Company B has a market cap of ₹1,000 crore, its FCF yield is 8.5 percent and its price to free cash flow is about 11.8. You can compare the FCF yield with the return on a fixed deposit or a government bond to see whether the stock is giving you a fair cash return for the risk.
What Indian Investors Can Learn From Real Companies
Recent trailing twelve month numbers from Simply Wall St analyses show how wide the gap between profit and cash can be, even for well-known companies.
- Nestlé India: Free cash flow of about ₹8.6 billion (roughly ₹860 crore) against a profit of about ₹32.4 billion (roughly ₹3,240 crore). That is a low conversion for a company with a strong brand.
- Castrol India: Free cash flow of about ₹8.5 billion (roughly ₹850 crore) against a profit of about ₹10.6 billion (roughly ₹1,060 crore), with an accrual ratio of 0.22.
- CCL Products (India): Negative free cash flow of about ₹2.1 billion (roughly ₹210 crore) against a profit of about ₹2.22 billion (roughly ₹222 crore).
- Uniparts India: Free cash flow of about ₹2.5 billion (roughly ₹250 crore), more than its profit of about ₹1.72 billion (roughly ₹172 crore). This is the opposite case, where cash is stronger than profit.
Please note that these are snapshots. Numbers change with every quarterly and annual result, so always check the latest figures on the company’s own filings before you make a decision. These examples are only meant to show that even household names can show a large gap between profit and cash.
Why Low Free Cash Flow Is Not Always Bad
A low FCF number should make you ask questions, not run away. There are good reasons for it.
- Heavy growth capex: A company that is building a new plant will show low FCF today but may earn much higher profit and cash in three to five years.
- Seasonal working capital: Some businesses stock up before the festival season or before the monsoon, which temporarily lowers cash flow.
- Lumpy projects: Infrastructure and engineering companies receive payments in milestones, so cash flow can swing from year to year.
The key is to separate maintenance capex (spending to keep the current business running) from growth capex (spending to expand). If the money is going into growth and the returns are good, low FCF is acceptable. You can check this with return on capital employed (ROCE). If ROCE is high and stable, the capex is probably creating value. If ROCE is falling while capex keeps rising, be careful.
Why High Accounting Profit With Weak Cash Can Be a Warning Sign
There are some patterns that deserve a closer look:
- Receivables growing faster than sales. The company may be offering generous credit terms or recording sales that are hard to collect.
- Inventory days rising year after year. Unsold stock can later lead to write-offs.
- Operating cash flow lower than net profit for three years or more. One weak year can be bad luck. Three is a pattern.
- Large “other income” in the profit. Profit from the sale of an asset or from a one-time gain does not repeat.
- Rising debt while profit is rising. If a company needs to borrow to fund a profitable business, ask where the cash is going.
- High capitalisation of expenses. When regular costs are treated as assets, profit looks better and operating cash flow stays the same.
How to Analyse Free Cash Flow Step by Step
Here is a simple method any retail investor can follow using the annual report or a screener site.
- Open the cash flow statement for the last 5 to 10 years. One year is never enough.
- Note the operating cash flow and capex for each year, and calculate free cash flow.
- Compare FCF with net profit over the full period. Add up the total profit and total FCF for ten years, and check the ratio. This smooths out the lumpy years.
- Look at the reasons for gaps. Read the notes on receivables, inventory and capex plans in the annual report and the management commentary.
- Check the balance sheet. Look at debt, interest cover and the cash balance.
- Check the return ratios. ROCE and ROE tell you if the money being reinvested is earning a good return.
- Look at valuation. Check the FCF yield and price to free cash flow against the company’s own history and against its peers.
No single ratio will give you the answer. Use free cash flow along with profit, growth, debt and valuation.
Frequently Asked Questions
What is free cash flow in simple words?
Free cash flow is the cash a company has left after paying for its day to day operations and its investment in machinery, buildings and other assets. It is the money that can be used for dividends, debt repayment or growth.
What is the difference between free cash flow and net profit?
Net profit is an accounting figure based on the accrual method and includes non-cash items such as depreciation. Free cash flow is based on actual cash movement and also takes capital expenditure and working capital changes into account.
How do you calculate free cash flow?
Free cash flow is operating cash flow minus capital expenditure. Both numbers are available in the cash flow statement of the company’s annual report.
What is a good FCF conversion ratio?
Many analysts look for a ratio of 80 to 100 percent or more over a long period, usually 5 to 10 years. Capital-heavy industries may show lower figures during expansion.
Can a company have positive profit and negative free cash flow?
Yes. This happens when a company spends heavily on capex, or when its receivables and inventory grow faster than its sales. It is common in the growth stage, but if it continues for many years, it deserves a closer look.
What is the accrual ratio and why does it matter?
The accrual ratio compares the gap between net profit and free cash flow with the company’s average operating assets. A low or negative ratio suggests that profits are backed by cash. A high ratio suggests the profit is mostly on paper.
Final Thoughts
Accounting profit is where the story of a company begins, but free cash flow is where you find out if the story is true. A business that grows its profit and also grows its free cash flow over the years is rare and valuable. A business that shows rising profit with weak or falling cash flow needs a closer look before you put your money in.
Before your next stock purchase, spend ten minutes on the cash flow statement. Compare ten years of profit with ten years of free cash flow. It is one of the simplest habits that can improve your stock selection.
This article is for educational purposes only and is not investment advice. Please do your own research or speak to a SEBI-registered investment adviser before investing.