
DCF Valuation in Practice: How Small Assumption Changes Can Transform Fair Value
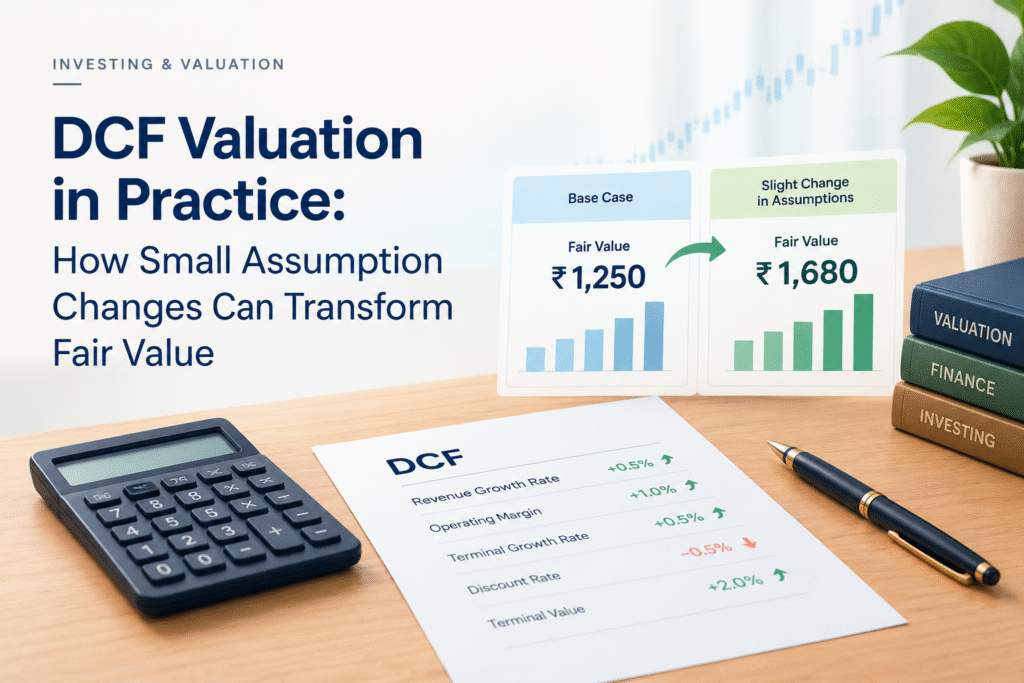
DCF valuation (discounted cash flow valuation) is a method of estimating the intrinsic value of a stock by projecting the free cash flow a company will produce in future and discounting it back to today’s money at a rate that reflects risk. The result is the fair value of the business. The catch is that the answer depends heavily on a handful of assumptions, and a change of one or two percentage points in any of them can move fair value by 10% to 50%.
If you have ever built a DCF model in Excel and felt that you could make a stock look cheap or expensive just by editing a cell, you are not imagining it. This guide shows exactly how that happens, using a worked DCF valuation example with real numbers, and then explains how to use the method honestly as an investor in Indian stocks.
In Short
- A DCF model has four main inputs: free cash flow, the growth rate, the discount rate (WACC), and the terminal growth rate.
- In our example, a company with a base fair value of ₹180 per share swings between ₹127 and ₹276 when three assumptions are changed by modest amounts.
- Terminal value usually makes up 60% to 80% of a DCF valuation, which is why the discount rate and terminal growth rate matter so much.
- The best use of DCF is as a range and a reality check, not as a single target price.
What Is DCF Valuation?
A rupee you receive five years from now is worth less than a rupee in your hand today. You could invest today’s rupee and earn a return on it, and the future rupee also carries the risk that it never arrives. A discounted cash flow model puts that idea into numbers.
The steps are simple to describe:
- Estimate the free cash flow the business will generate each year for the next five to ten years.
- Estimate what the business will be worth at the end of that period (the terminal value).
- Discount all of those cash flows back to the present using the weighted average cost of capital (WACC).
- Add them up to get the enterprise value.
- Subtract net debt to get the equity value, and divide by the number of shares to get the intrinsic value per share.
Warren Buffett and Charlie Munger have often said that the value of any business is the cash it can hand to its owners over its life, discounted at a suitable rate. DCF is the formal version of that thought.
The DCF Formula and Its Key Inputs
The basic DCF formula is:
Enterprise Value = Sum of [FCF in year t ÷ (1 + WACC)^t] + Terminal Value ÷ (1 + WACC)^n
And the terminal value, using the Gordon growth model, is:
Terminal Value = FCF in final year × (1 + g) ÷ (WACC − g)
Here is what each input means.
Free cash flow (FCF). This is the cash left after operating costs, taxes, capital expenditure and changes in working capital. For most DCF models, analysts use free cash flow to the firm (FCFF), which belongs to both lenders and shareholders.
Growth rate. The yearly growth in free cash flow during the forecast period. This usually follows revenue growth and margin expectations.
WACC (weighted average cost of capital). The blended return that lenders and shareholders expect. The cost of equity is commonly estimated with the CAPM formula: risk-free rate plus beta times the equity risk premium. In India, the 10-year government bond yield is the usual proxy for the risk-free rate. It was around 7.2% in early October 2026, according to Trading Economics, up from roughly 6.7% in early July.
Terminal growth rate (g). The rate at which cash flows are assumed to grow forever after the forecast period ends. It should sit below the long-term nominal growth of the economy. For Indian companies, 4% to 6% is a common range.
Net debt and share count. These convert enterprise value into value per share. Small errors here are easy to avoid, so get them right.
A Worked DCF Valuation Example
Take a made-up company, Sample Industries Ltd, with these base-case assumptions:
- Current free cash flow: ₹100 crore
- Growth rate for the next 5 years: 12% a year
- WACC: 12%
- Terminal growth rate: 5%
- Net debt: ₹200 crore
- Shares outstanding: 10 crore
First, the forecast and the present value of each year’s cash flow:
| Year | Free Cash Flow (₹ crore) | Present Value at 12% (₹ crore) |
|---|---|---|
| 1 | 112.0 | 100.0 |
| 2 | 125.4 | 100.0 |
| 3 | 140.5 | 100.0 |
| 4 | 157.4 | 100.0 |
| 5 | 176.2 | 100.0 |
| Total | 500.0 |
Now the terminal value. Year 5 free cash flow is ₹176.2 crore, so the terminal value is 176.2 × 1.05 ÷ (0.12 − 0.05), which is about ₹2,643 crore. Discounted back five years at 12%, the present value of the terminal value is ₹1,500 crore.
| Component | Value (₹ crore) |
|---|---|
| PV of 5-year free cash flows | 500 |
| PV of terminal value | 1,500 |
| Enterprise value | 2,000 |
| Less: net debt | 200 |
| Equity value | 1,800 |
| Fair value per share | ₹180 |
So the base-case intrinsic value is ₹180 per share. Notice that 75% of the enterprise value comes from the terminal value, the part of the model that is furthest from anything we can observe. That is normal. It is also the reason small changes matter so much.
How Small Assumption Changes Move Fair Value
Now we change one assumption at a time and keep everything else the same.
Changing the discount rate (WACC)
| WACC | Fair Value per Share | Change from ₹180 |
|---|---|---|
| 11% | ₹214 | +19% |
| 12% (base) | ₹180 | 0% |
| 13% | ₹154 | -14% |
A single percentage point in WACC moves fair value by 14% to 19%. Even a half-point rise to 12.5% cuts the value to ₹166, a fall of about 8%. This is close to what happens in real markets when bond yields rise. If the 10-year yield goes from 6.7% to 7.2% and nothing else changes, the discount rate of every stock goes up by roughly half a point, and every DCF fair value falls with it.
Changing the terminal growth rate
| Terminal Growth | Fair Value per Share | Change from ₹180 |
|---|---|---|
| 4% | ₹160 | -11% |
| 5% (base) | ₹180 | 0% |
| 6% | ₹207 | +15% |
One point of difference in the long-term growth rate, a number nobody can know with confidence, changes the answer by more than ₹45 per share between the two ends.
Changing the near-term growth rate
| 5-Year Growth Rate | Fair Value per Share | Change from ₹180 |
|---|---|---|
| 10% | ₹165 | -9% |
| 12% (base) | ₹180 | 0% |
| 14% | ₹197 | +9% |
The growth rate during the forecast period has the smallest effect of the three, even though most investors spend the most time debating it. Years one to five are only 25% of the value in this model.
Changing all three together
Now suppose an optimistic analyst uses 14% growth, 11% WACC and 6% terminal growth. A cautious analyst uses 10% growth, 13% WACC and 4% terminal growth. Neither analyst is being unreasonable.
- Optimistic fair value: ₹276 per share (54% above base)
- Cautious fair value: ₹127 per share (29% below base)
The same company, with the same current cash flow, has a fair value that differs by more than double. If the stock trades at ₹200, the optimist calls it a bargain and the cautious analyst calls it overpriced. Both can show you a spreadsheet to prove it.
The Sensitivity Table Every DCF Should Have
A DCF sensitivity analysis shows fair value across a grid of WACC and terminal growth values. Here is the grid for our example:
| WACC \ Terminal Growth | 4% | 5% | 6% |
|---|---|---|---|
| 11% | ₹187 | ₹214 | ₹253 |
| 12% | ₹160 | ₹180 | ₹207 |
| 13% | ₹139 | ₹154 | ₹174 |
Nine cells, and fair value ranges from ₹139 to ₹253. If an equity research report gives you only one number and no table like this, treat that number with caution.
Why Terminal Value Is So Sensitive
The reason lies in the terminal value formula. The denominator is WACC minus g. In our base case, that is 12% minus 5%, or 7%. When WACC rises to 13% and g falls to 4%, the denominator becomes 9%. When WACC falls to 11% and g rises to 6%, it becomes 5%. The terminal value is divided by a number that can nearly halve or nearly double from small changes at each end.
This also tells you something about stocks that look expensive on a DCF. When WACC and terminal growth are close together, the model produces huge values. A common mistake is to push terminal growth to 7% or 8% for a “high quality” company. No business can grow faster than the economy forever, because eventually it would become larger than the economy.
Beta and the Cost of Equity
Many retail investors copy beta from a stock website without a second thought. For a company funded mostly by equity, with a risk-free rate of 7.2% and an equity risk premium of 5.5%, a beta of 0.9 gives a cost of equity near 12.2%. A beta of 1.1 gives about 13.3%. That gap of over one percentage point is worth 14% to 19% of fair value, as the WACC table above shows. Beta over two years can differ a lot from beta over five years, so check more than one source.
Using a Reverse DCF
A reverse DCF flips the question. Instead of asking what a stock is worth, you ask what the current price implies. Fix a reasonable WACC and terminal growth rate, then solve for the growth rate that justifies the price.
Say Sample Industries trades at ₹250. At a 12% WACC and 5% terminal growth, the market is pricing in close to 20% annual growth in free cash flow for five years. Now you can ask a better question: has this company ever grown cash flow that fast, and can it do so again?
How to Use DCF Honestly
1. Work with a range. Build a bear, base and bull case, each with its own growth, margin and WACC inputs.
2. Check the terminal value share. If more than 75% to 80% of enterprise value comes from the terminal value, you are mostly valuing the distant future. Lengthen the forecast period or be more conservative.
3. Cross-check with relative valuation. Compare the implied multiple with the P/E ratio and EV/EBITDA of similar companies. A DCF that implies 40 times earnings for a slow-growth company has a problem.
4. Keep terminal growth below nominal GDP growth. For India, 4% to 6% is sensible. If you go outside that range, write down why.
5. Use a margin of safety. If your base-case fair value is ₹180, you may not want to buy above ₹135 to ₹145. The gap protects you when assumptions turn out wrong.
6. Update the model after every quarterly result. A DCF built a year ago is a snapshot of an old opinion.
Common DCF Valuation Mistakes
- Starting from the answer. If you decide a stock is a buy first and then adjust inputs until the fair value agrees, the model is a decoration.
- Ignoring capital expenditure. High growth needs heavy investment. Forecasting growth without matching capex and working capital overstates free cash flow.
- Mixing nominal and real numbers. Nominal cash flows need a nominal discount rate.
- Using the wrong rate for the cash flow. FCFF is discounted at WACC. Free cash flow to equity is discounted at the cost of equity.
- Forgetting dilution and obligations. ESOPs and convertibles raise the share count. Large lease liabilities and pension gaps belong in net debt.
- Applying DCF to the wrong business. Banks and NBFCs use debt as raw material, so standard FCFF models do not suit them. Use a dividend discount or residual income model instead.
Final Thoughts
DCF valuation is one of the most useful stock valuation methods, and also one of the easiest to misuse. The worked example shows that a company worth ₹180 per share in the base case can be worth ₹127 or ₹276 with modest changes in WACC, terminal growth and near-term growth. That range is not a flaw in the method. It is an honest picture of how uncertain the future is.
The investors who get the most from discounted cash flow analysis are the ones who know which assumptions drive the answer, test them in a sensitivity table, and buy only when the price leaves room for being wrong.
Frequently Asked Questions About DCF Valuation
What is DCF valuation in simple words? DCF valuation estimates what a business is worth today by adding up all the cash it is expected to produce in the future, after reducing each amount for the time value of money and risk. The total is the intrinsic value of the company.
How do you calculate DCF step by step? Forecast free cash flow for five to ten years, estimate a terminal value, discount all cash flows at the WACC, add them to get enterprise value, subtract net debt to get equity value, and divide by the number of shares to get fair value per share.
What is a good WACC for Indian stocks? It depends on the company, but most Indian companies fall between 10% and 14%. The 10-year government bond yield, which was near 7.2% in October 2026, forms the base. Add an equity risk premium adjusted for the company’s beta and debt mix.
What is the terminal growth rate in a DCF model? The terminal growth rate is the yearly rate at which free cash flow is assumed to grow forever after the forecast period. It should stay below the long-term growth of the economy. For India, 4% to 6% is commonly used.
Why is DCF so sensitive to small changes in assumptions? Most of the value comes from the terminal value, which is calculated by dividing cash flow by the difference between WACC and the terminal growth rate. A small change in either number changes that difference by a large percentage, and the whole valuation moves with it.
Is DCF valuation accurate? DCF is only as accurate as its inputs. It works best for stable businesses with predictable cash flows and is less reliable for banks, cyclical firms and early-stage companies. Use it to build a range, not a single price target.
What is a reverse DCF? A reverse DCF starts with the current market price and works backwards to find the growth rate the market is expecting. It helps you judge whether the price already assumes more than the company can deliver.
Can retail investors use DCF for Indian stocks? Yes. Annual reports, quarterly results and free screeners give you the data for free cash flow, debt and share count. A simple spreadsheet with a sensitivity table is enough to start.
What is the difference between DCF and the P/E ratio? The P/E ratio compares price with current earnings and depends on how the market values similar stocks. DCF values a company on its own future cash flows. The two methods work best together.
Disclaimer: This article is for educational purposes only. The company in the example is imaginary, and the figures are illustrative. Nothing here is investment advice or a recommendation to buy or sell any security. Please consult a SEBI-registered investment adviser before making investment decisions.