
Growth vs Value: How Investors Can Analyse the Trade-Off Quantitatively
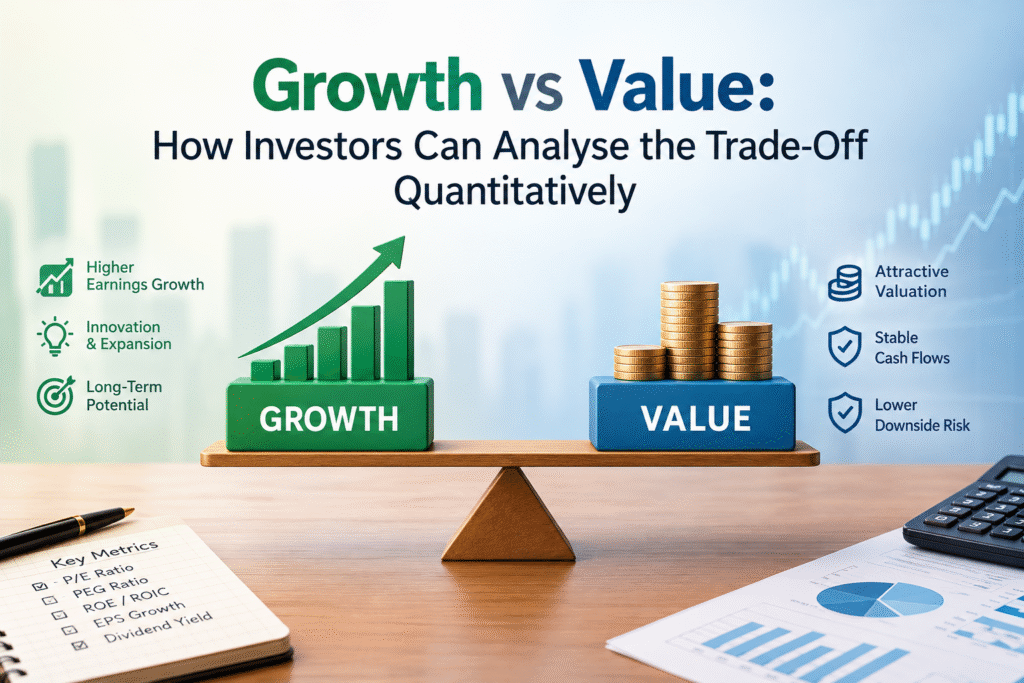
Growth vs value investing is a choice between paying a high price for fast-growing earnings and paying a low price for earnings the market has marked down. Growth stocks usually trade at high P/E ratios because investors expect profits to compound quickly. Value stocks trade at low P/E and price-to-book ratios because investors expect little, and sometimes expect trouble. Neither style wins in every period. The better question is not “which style is better” but “what growth is this stock already priced for, and is that believable?” This guide shows how to answer that question with numbers you can pull from any free stock screener.
What Is the Difference Between Growth Stocks and Value Stocks?
A growth stock is a company whose earnings or revenue are expected to grow much faster than the economy or the market. Think of a fast-expanding consumer brand, a software exporter gaining market share, or a lender adding customers every quarter. Investors pay up for that growth, so the stock usually carries a high P/E ratio, a high price-to-book ratio and a small dividend yield.
A value stock is a company trading below what its earnings, assets or cash flows suggest it is worth. These are often mature businesses in banking, energy, metals, utilities and public sector enterprises. The P/E is low, the dividend yield is higher and the growth rate is modest.
The label alone tells you very little. A company can be a growth business that is reasonably priced, or a value-looking company that is cheap for a good reason. That is why the trade-off has to be measured, not guessed.
The Key Metrics: P/E, Earnings Yield, P/B, PEG and ROE
Before running any comparison, get comfortable with the tools. Each one answers a different question about price, growth or quality.
| Metric | Formula | What it tells you | Usual reading |
|---|---|---|---|
| Price to earnings (P/E) | Price ÷ EPS | Rupees paid for ₹1 of yearly profit | High for growth, low for value |
| Earnings yield | EPS ÷ Price | Profit return on the price you pay | Low for growth, high for value |
| Price to book (P/B) | Price ÷ Book value per share | Price paid for net assets | High for growth, low for value |
| PEG ratio | P/E ÷ expected EPS growth (in %) | Price paid per unit of growth | Near or below 1 is often called fair |
| Return on equity (ROE) | Net profit ÷ Shareholders’ equity | How well the business uses capital | High and steady points to quality |
| Free cash flow yield | Free cash flow ÷ Market cap | Cash left after capex, against price | Higher is better |
| Dividend yield | Dividend per share ÷ Price | Cash paid out to shareholders | Higher for value |
The PEG rule of thumb, popularised by Peter Lynch, is a starting point and not a law. It works best for companies with steady, positive growth.
Step 1: Turn P/E Into Earnings Yield
The simplest quantitative step is to flip the P/E ratio upside down. A stock at a P/E of 40 has an earnings yield of 2.5%. A stock at a P/E of 10 has an earnings yield of 10%. The Nifty 50, which has traded close to a P/E of 20 in recent months, sits near a 5% earnings yield.
Now compare that number with the current 10-year government bond yield and with fixed deposit rates, both of which you can check on the RBI website or your bank’s page. A stock earning 2.5% on your money today has to grow its profits a great deal before it beats a government bond. A stock earning 10% already pays a decent return before any growth shows up. This one comparison explains why growth stocks feel risky when interest rates rise.
Step 2: Use the PEG Ratio to Compare Price Against Growth
P/E ignores growth, so the next step is the PEG ratio. Take two examples.
- Company A is a growth stock with a P/E of 40 and expected earnings growth of 25% a year. PEG = 40 ÷ 25 = 1.6.
- Company B is a value stock with a P/E of 12 and expected earnings growth of 8% a year. PEG = 12 ÷ 8 = 1.5.
Company A looks more than three times as expensive on P/E, yet the two stocks cost almost the same for each unit of growth. A high P/E does not always mean expensive, and a low P/E does not always mean cheap.
The PEG ratio has limits. It depends on a growth forecast, and forecasts are often too hopeful. Use a conservative estimate, such as the lower of the past five-year earnings CAGR and the analyst consensus. Avoid PEG for cyclical companies, for businesses with falling profits, and for any stock where growth is close to zero.
Step 3: Test Whether the Growth Is Sustainable
A growth rate is only useful if the business can pay for it. A quick check is the sustainable growth rate:
Sustainable growth = ROE × Retention ratio
Suppose a company earns an ROE of 20% and pays out 25% of profit as dividends. It retains 75%, so its sustainable growth is 20% × 0.75 = 15%. If the market is pricing in 25% growth, the company needs to raise fresh capital, lift its margins or take on debt. Any of those can hurt shareholders.
For every stock, growth or value, run a short quality check:
- ROCE above the cost of capital, ideally above 15% for five years in a row
- Operating cash flow close to or above net profit
- Debt to equity below 1 for non-financial companies
- Interest coverage comfortably above 3
This check protects you from the value trap, which is a stock that looks cheap on P/E or P/B but keeps getting cheaper because its earnings are shrinking or its accounts are weak. It also protects you from the growth trap, where you pay a high multiple for growth that slows down.
Step 4: Run a Reverse DCF to See What the Price Already Assumes
A normal discounted cash flow model starts with a growth forecast and arrives at an intrinsic value. A reverse DCF works the other way round. It starts with today’s price and asks what growth the market is already counting on. You do not need a complex model. A simple version works like this:
- Take the current price and decide the annual return you want, say 12% for ten years.
- Work out the price the stock must reach in year ten.
- Assume a sensible exit P/E.
- Divide the future price by that P/E to get the EPS needed.
- Find the yearly EPS growth that gets you there.
Here is the worked comparison, ignoring dividends to keep the arithmetic clear.
| Growth stock | Value stock | |
|---|---|---|
| Current P/E | 40 | 10 |
| EPS today | ₹50 | ₹100 |
| Price today | ₹2,000 | ₹1,000 |
| Target return | 12% a year for 10 years | 12% a year for 10 years |
| Price needed in year 10 | about ₹6,212 | about ₹3,106 |
| Assumed exit P/E | 22 | 12 |
| EPS needed in year 10 | about ₹282 | about ₹259 |
| EPS growth needed each year | about 18.9% | about 10.0% |
The growth stock has to grow profits at nearly 19% a year for a decade while its P/E falls from 40 to 22. Very few companies manage that. The value stock needs about 10% a year, which is closer to what a steady business can deliver. This is the expectations gap, and it is the cleanest way to see the trade-off in numbers.
Now compare the required growth with the company’s own record. If the five-year EPS CAGR is 22% and the business has room to expand, the growth stock may well deliver. If the record shows 9%, the price is asking for a miracle.
Step 5: Compare the Value Spread and Look at the Evidence
You can also measure how much cheaper value stocks are than the broad market. This gap is called the value spread. As of July 2026, NSE index data compiled by IndexPE showed the Nifty 50 at a P/E of about 20.65 and the Nifty500 Value 50 index at about 9.79. The value index was trading at roughly 47% of the Nifty 50 multiple.
The returns tell a mixed story, as they should. According to the same NSE factsheet data, as of June 2026 the Nifty500 Value 50 delivered a one-year total return of about 13.95% and about 26.20% a year over five years. The Nifty 50 total return index showed about -5.42% over one year and about 9.99% a year over five years. The value index was also more volatile, with annual volatility of about 16.25% against 13.05% for the Nifty 50.
Two cautions apply. First, a five-year window is sensitive to the starting date, and this one begins from a weak base for value stocks. Second, value is not low risk. One Nifty 500 Value 50 index fund recorded a maximum drawdown of about 22% between September 2024 and February 2025, and took around ten months to recover its earlier peak. NSE’s own research on the index notes that value tends to do best during strong economic recoveries, which means it can lag for long stretches before it catches up.
Use index data as a reference point, then test your own picks. Look at rolling returns, the Sharpe ratio and maximum drawdown for both a growth fund and a value fund over the same period, not just the best-looking trailing number.
Step 6: Build a Simple Growth-Value Scorecard
Put the steps together in a short scorecard. Give each stock one point for every test it passes. The thresholds below are examples, so adjust them by sector.
- Earnings yield higher than the 10-year government bond yield
- PEG ratio at or below 1.5
- ROCE above 15% for the last five years
- Operating cash flow at least 80% of net profit
- Debt to equity below 1, excluding banks and finance companies
- Growth needed in the reverse DCF lower than the five-year EPS CAGR
A stock scoring five or six is worth deeper research whether it looks like growth or value. A stock scoring two or three is probably cheap or popular for a reason. The last test is the most useful, because it forces you to compare what the price needs with what the business has actually done.
How Interest Rates and the Market Cycle Change the Trade-Off
Growth stocks are long-duration assets. Most of their value sits in profits expected many years from now, so a higher discount rate cuts their present value more sharply than it cuts the value of a steady, cash-rich company. When bond yields rise, high P/E stocks have usually fallen further than low P/E stocks. When rates fall and growth is hard to find, investors tend to pay more for the companies that can still grow.
This does not mean you should try to time the switch. Almost nobody gets that call right year after year. It does mean you should know which way your portfolio leans, and check how it would behave if rates moved by one or two percentage points.
Common Mistakes When Comparing Growth and Value
- Judging a stock by P/E alone. A cyclical company can show a low P/E at peak profits, right before earnings fall.
- Buying a value trap. Low P/B on a bank with rising bad loans is not a bargain.
- Paying for growth that never arrives. When growth slows, the earnings fall and the multiple falls too, so the loss comes twice.
- Using one year of data. Look at five to ten years of earnings, margins and cash flow.
- Ignoring costs. Index funds and ETFs differ in expense ratio and tracking error, and a higher cost eats directly into the style premium.
How Retail Investors in India Can Use Both Styles
You do not have to pick a side. Many investors hold a core of low-cost broad market index funds and add a smaller growth or value tilt around it. Others follow growth at a reasonable price, usually called GARP, which means looking for companies with a PEG near or below 1.5 and strong ROCE.
A practical routine looks like this: screen with the scorecard once a quarter, run the reverse DCF before buying any stock, invest through a monthly SIP, and rebalance once a year. If you use factor funds, read the index methodology first so you know what the fund actually owns.
Frequently Asked Questions
What is the main difference between growth and value investing?
Growth investing targets companies expected to grow earnings quickly and accepts high valuations for them. Value investing targets companies priced below their estimated intrinsic value and accepts slower growth. Growth investors pay for the future. Value investors look for a margin of safety in the present price.
Which is better for Indian investors, growth or value?
Neither is better in every period. Value tends to do well in recoveries and when interest rates are high, while growth tends to do well when rates fall and earnings expand quickly. A blend of both, held through a long-term SIP, reduces the risk of backing the wrong style at the wrong time.
What is a good PEG ratio for growth stocks?
A PEG ratio near or below 1 is often treated as fair value, and many investors accept up to about 1.5 for high-quality businesses. A PEG above 2 usually means the price already assumes strong growth. The figure is only as reliable as the growth estimate behind it.
How do I know if a cheap stock is a value trap?
Check whether earnings, margins and operating cash flow are falling, whether debt is rising and whether ROCE is below the cost of capital. A cheap stock with weak and worsening numbers is a value trap. A cheap stock with steady cash flow and a clear reason for the discount may be real value.
Can I hold growth and value stocks together?
Yes. Holding both can smooth returns because the two styles often lead at different times. Keep each position sized so that no single stock or style can badly damage the overall portfolio.
Which ratios compare growth and value stocks best?
Use earnings yield and P/E for price, PEG for price against growth, ROE and ROCE for quality, free cash flow yield for cash returns, and a reverse DCF to see the growth already built into the price.
Conclusion
Growth and value are two ways of paying for the same thing, which is future profit. Growth investors pay early and hope the profit arrives. Value investors pay little and hope the market corrects its view. You can compare the two without opinions by turning P/E into earnings yield, checking the PEG ratio, testing sustainable growth and running a reverse DCF to see what the price expects. The stock that needs the least heroic assumptions, backed by real cash flow, is usually the better buy, whatever label it carries.
This article is for education only and is not investment advice. Past returns do not guarantee future results. Market data in this article comes from NSE factsheet data as compiled by IndexPE (July 2026 values and June 2026 returns) and from fund performance trackers. Please check live figures before acting and speak to a SEBI-registered investment adviser for advice on your own situation.