
Terminal Value in DCF Models: Why Long-Term Assumptions Matter So Much
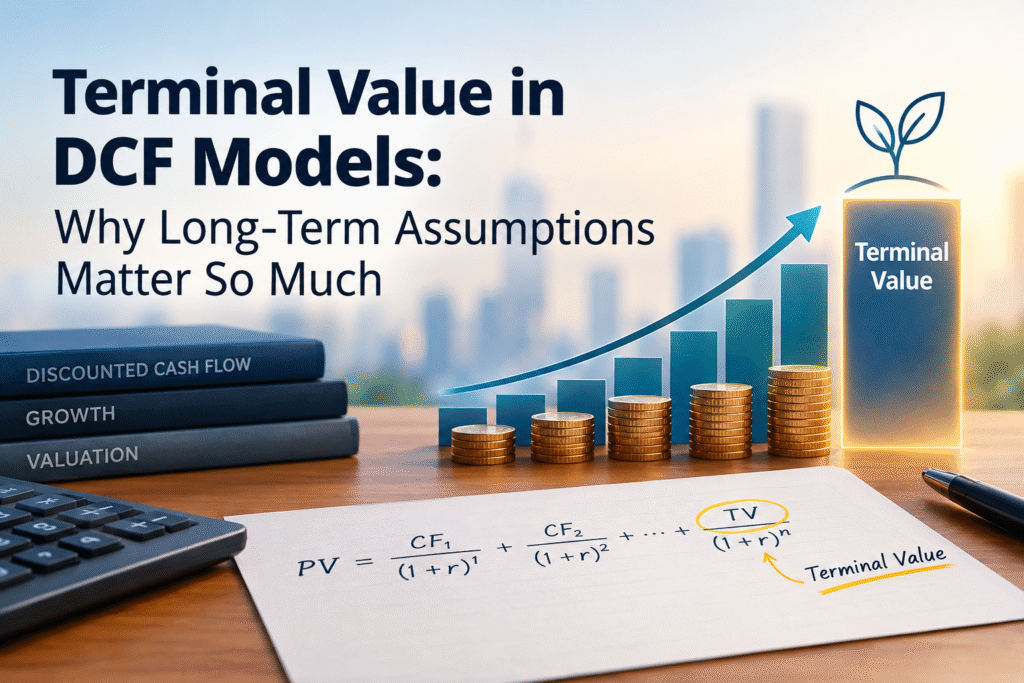
If you build a discounted cash flow model for a company, you will notice something odd within the first hour. You spend most of your time forecasting five or ten years of cash flows, and then a single line at the end, the terminal value, decides most of the answer.
That is not a flaw in your spreadsheet. It is how the maths of a going concern works. This guide explains what terminal value is, how to calculate it, why it often makes up 70 to 80 per cent of a DCF valuation, and how to choose long-term assumptions that you can defend.
What Is Terminal Value in a DCF Model?
Terminal value is the estimated worth of a business at the end of the explicit forecast period, based on all the free cash flows it is expected to generate after that point. In a DCF model, it is discounted back to today and added to the present value of the forecast cash flows to arrive at enterprise value.
A company does not stop existing after year five or year ten. A DCF model only forecasts a limited number of years in detail because nobody can predict a company’s cash flows 30 years ahead with any real accuracy. Terminal value is the shortcut that captures everything beyond the forecast window in one number.
The full DCF valuation therefore has two parts:
- The present value of free cash flows during the forecast period (usually 5 to 10 years).
- The present value of the terminal value.
Add the two and you get enterprise value. Subtract net debt and you get equity value, which you divide by the number of shares to reach an intrinsic value per share.
Why Terminal Value Matters So Much
Three things push terminal value to the centre of every DCF.
First, it covers an endless period. The forecast period is a few years. The terminal period has no end date. Even after heavy discounting, a perpetual stream of cash flows adds up to a large sum.
Second, it sits on top of the final forecast year. Any mistake in the last year’s free cash flow gets multiplied by the terminal value formula. A small error in year five becomes a big error in the valuation.
Third, it depends on just two or three assumptions. The terminal growth rate, the discount rate (WACC) and, in the exit multiple approach, the chosen multiple. Each of these is a judgement call, and each has a large effect on the result.
In a typical DCF for a stable, profitable business, terminal value accounts for roughly 60 to 80 per cent of enterprise value. For a young company with small near-term cash flows, the share can go above 90 per cent. This is the reason experienced analysts say a DCF is only as good as its long-term assumptions.
Method 1: Perpetuity Growth Method (Gordon Growth Model)
The perpetuity growth method assumes the company’s free cash flow grows at a steady rate forever. It uses the Gordon Growth Model.
Terminal Value = FCF in final year × (1 + g) ÷ (WACC − g)
Where:
- FCF is the free cash flow to the firm in the last forecast year.
- g is the terminal growth rate.
- WACC is the weighted average cost of capital, used as the discount rate.
The top of the formula is next year’s cash flow, which is why you multiply by (1 + g). The bottom is the gap between the discount rate and the growth rate. When that gap is small, terminal value becomes very large. This one fact explains most of the trouble people run into.
To bring the number to today’s money, you discount it using the same factor as the final forecast year:
Present Value of Terminal Value = Terminal Value ÷ (1 + WACC)^N
Here N is the number of years in the forecast period.
Method 2: Exit Multiple Method
The exit multiple method assumes the business is sold at the end of the forecast period at a multiple of some earnings or cash flow measure, most commonly EV/EBITDA.
Terminal Value = Final-year EBITDA × Exit multiple
The multiple usually comes from what similar listed companies trade at today. Analysts like this method because it ties the valuation to the market. The weakness is that it brings today’s market mood into a long-term model. If the sector is trading at a peak multiple, your DCF quietly assumes the peak lasts for ever.
Perpetuity Growth vs Exit Multiple: A Quick Comparison
| Point | Perpetuity Growth Method | Exit Multiple Method |
|---|---|---|
| Basis | Intrinsic cash flow growth | Market-based multiple |
| Key inputs | Terminal growth rate, WACC | EV/EBITDA multiple |
| Main risk | Growth rate set too high | Multiple set at a market peak |
| Best used for | Stable, mature businesses | Sectors with many listed peers |
| Common practice | Use one as the base, the other as a cross-check | Use one as the base, the other as a cross-check |
Most careful analysts calculate both and compare. If the two numbers are far apart, one of your assumptions needs another look.
A Worked Example of Terminal Value in a DCF
Take a company with the following free cash flow to the firm over five years (in ₹ crore). Assume a WACC of 12 per cent and a terminal growth rate of 5 per cent.
| Year | FCFF (₹ crore) | Discount factor at 12% | Present value (₹ crore) |
|---|---|---|---|
| 1 | 100 | 0.893 | 89.3 |
| 2 | 115 | 0.797 | 91.7 |
| 3 | 130 | 0.712 | 92.5 |
| 4 | 145 | 0.636 | 92.2 |
| 5 | 160 | 0.567 | 90.8 |
| Total | 456.4 |
Step 1: Terminal value at the end of year 5
160 × 1.05 ÷ (0.12 − 0.05) = 168 ÷ 0.07 = ₹2,400 crore
Step 2: Present value of terminal value
2,400 × 0.567 = ₹1,361.8 crore
Step 3: Enterprise value
456.4 + 1,361.8 = ₹1,818.2 crore
Look at the split. The five years of forecast cash flows that you worked hard on contribute ₹456 crore. The terminal value contributes ₹1,362 crore, which is about 75 per cent of the total. A cross-check helps here: the terminal value of ₹2,400 crore is 15 times the year-five free cash flow. That is a reasonable number for a steady business, and it tells you the model has not run away.
How Sensitive Is Terminal Value to Small Changes?
This is the part that surprises most beginners. Keep the same cash flows and change only the terminal growth rate.
Effect of terminal growth rate (WACC fixed at 12%)
| Terminal growth rate | Terminal value (₹ crore) | Enterprise value (₹ crore) | Terminal value share of EV |
|---|---|---|---|
| 3% | 1,831 | 1,495 | 69.5% |
| 4% | 2,080 | 1,637 | 72.1% |
| 5% | 2,400 | 1,818 | 74.9% |
| 6% | 2,827 | 2,060 | 77.8% |
Moving the growth rate from 4 per cent to 6 per cent raises enterprise value by about 26 per cent. Nothing about the business changed. Only a long-term opinion changed.
Now keep growth at 5 per cent and change the discount rate.
Effect of WACC (terminal growth fixed at 5%)
| WACC | Enterprise value (₹ crore) | Change from base case |
|---|---|---|
| 11% | 2,131 | +17.2% |
| 12% | 1,818 | Base case |
| 13% | 1,584 | −12.9% |
A one percentage point change in WACC moves the valuation by 13 to 17 per cent. If you then combine a slightly high growth rate with a slightly low WACC, the DCF can show a stock as a bargain when it is fairly priced, or the other way round. This is why sensitivity analysis is not an optional extra. It belongs in every DCF you present.
What Happens When Growth Gets Close to WACC
The denominator of the Gordon Growth formula is WACC minus g. As g moves toward WACC, that gap shrinks and the answer explodes.
Using the same example, if you set the terminal growth rate at 11 per cent against a WACC of 12 per cent, the terminal value becomes 160 × 1.11 ÷ 0.01 = ₹17,760 crore. That is more than seven times the earlier figure, from a one-point change in the growth assumption. No sensible analyst would believe it, yet spreadsheets will happily produce it.
If g is ever equal to or higher than WACC, the formula stops working altogether.
How to Choose the Terminal Growth Rate
The terminal growth rate is the rate at which free cash flow grows every year, forever. A few rules keep it sensible.
1. Do not let it exceed long-term nominal economic growth. A company that grows faster than the economy for ever would eventually become larger than the economy. That cannot happen.
2. Keep it below the risk-free rate. In India, the 10-year government bond yield is the usual proxy for the risk-free rate. It stayed above 7 per cent through much of October 2026, touching a three-year high of about 7.37 per cent on 12 October. A terminal growth rate above that level would be hard to explain.
3. Think in a range, not a point. For Indian companies, analysts commonly work with terminal growth rates somewhere between 4 and 6 per cent, and lower for cyclical or capital-heavy businesses. Treat this as a working range for discussion, not a rule.
4. Match growth to reinvestment. Growth is not free. A company needs to reinvest to grow. A consistent terminal year follows this relationship:
Terminal FCFF = NOPAT × (1 − g ÷ ROIC)
Here NOPAT is net operating profit after tax and ROIC is return on invested capital. If you assume 5 per cent growth and a 15 per cent ROIC, the company has to reinvest one third of its operating profit. Many models assume growth but forget the reinvestment, which overstates value.
5. Fade growth gradually. If a company grows at 20 per cent today, jumping straight to 5 per cent in the terminal year is abrupt. Extend the forecast to ten years, or add a fade period where growth steps down year by year, so that the final-year cash flow is a fair base for the terminal calculation.
How to Choose the Discount Rate (WACC)
WACC combines the cost of equity and the cost of debt, weighted by how much of each the company uses. The cost of equity is usually estimated with the capital asset pricing model, which relies on the risk-free rate, the equity risk premium and beta.
Two cautions apply to the terminal period:
- Capital structure drifts toward the long-term average. A company with heavy debt today may not carry that debt for ever. Using today’s WACC for the terminal period can be too high or too low.
- Beta tends to move toward 1 over time. Very high or very low betas do not usually last for decades.
Small adjustments here matter as much as the growth rate, as the WACC table above shows.
Common Mistakes in Terminal Value Calculation
- Using an abnormal final year. If year five has unusually low capital spending or a one-off gain, the terminal value copies that distortion into perpetuity. Normalise the final-year cash flow first.
- Setting depreciation far above capital spending. In the long run, a company must spend enough to maintain its assets. If capital expenditure stays below depreciation in the terminal year, the model assumes the asset base shrinks while cash flow grows.
- Choosing a growth rate to hit a target price. Working backwards from the price you want is a common habit and a poor one.
- Applying a peak market multiple. An exit multiple taken from a boom period builds the boom into every year after.
- Mixing up discount factors. Terminal value is discounted at the factor for year N, the final forecast year, and not year N plus one.
- Showing one number only. A single-point valuation hides the range of reasonable outcomes.
How to Sanity-Check Your Terminal Value
Before you trust the output, run a few quick checks.
- Terminal value as a share of enterprise value. If it is above 85 or 90 per cent, your explicit forecast is probably too short, or the business is too early-stage for a DCF to be reliable.
- Implied exit multiple. Convert the perpetuity-growth terminal value into an EV/EBITDA multiple and compare it with where mature peers trade.
- Implied perpetuity growth. If you used the exit multiple method, work out what growth rate it implies. If it is above the risk-free rate, the multiple is too high.
- Terminal ROIC. Check that your terminal growth and reinvestment give a return on new capital that is believable. A company earning 40 per cent on new investment for ever has no competition, which is rarely true.
- Compare with the market price. If the DCF value is double or half the current price, ask what the market knows that you do not before you act on the gap.
Why This Matters for Indian Retail Investors
Many investors in India see a DCF value on a stock research report or a screening website and treat it as a fact. It is an opinion built on assumptions. Knowing how the terminal value is built lets you read those reports with the right amount of caution.
When you see a target price, ask three questions. What terminal growth rate did the analyst use? What WACC? What share of the value comes from the terminal period? If the report does not say, treat the number with care. A good DCF always shows its working and its sensitivity table.
Frequently Asked Questions
What is terminal value in a DCF model?
Terminal value is the present worth of all cash flows a business is expected to produce after the explicit forecast period. It is calculated at the end of that period, discounted back to today, and added to the present value of the forecast cash flows to give enterprise value.
How do you calculate terminal value?
There are two common ways. The perpetuity growth method uses the formula final-year FCF × (1 + g) ÷ (WACC − g). The exit multiple method multiplies final-year EBITDA by an EV/EBITDA multiple taken from comparable companies. Both results are then discounted to present value.
Why is terminal value so large in a DCF?
Terminal value covers every year after the forecast, with no end date. Even after discounting, an endless stream of cash flows has a large present value. For most mature companies it makes up 60 to 80 per cent of enterprise value, and often more for fast-growing firms.
What is a good terminal growth rate?
A terminal growth rate should not exceed the long-term nominal growth of the economy and should stay below the risk-free rate. For Indian companies, analysts often work with a range of about 4 to 6 per cent, with lower figures for cyclical or capital-heavy businesses.
Which is better, the Gordon Growth Model or the exit multiple method?
Neither is better in every case. The Gordon Growth Model rests on the company’s own cash flows and suits stable businesses. The exit multiple method reflects market pricing and suits sectors with many listed peers. Using both and comparing them is the safer practice.
What percentage of a DCF valuation should be terminal value?
There is no fixed figure, but 60 to 80 per cent is common for established businesses. If terminal value passes 85 or 90 per cent of enterprise value, the forecast period is probably too short or the business too uncertain for a DCF to be dependable.
Can terminal growth be higher than WACC?
No. If the terminal growth rate equals or exceeds WACC, the Gordon Growth formula gives an infinite or negative value, which has no meaning. Growth also has to stay below the risk-free rate and long-term economic growth to be believable.
Conclusion
Terminal value is the largest single piece of most DCF models, and it rests on a handful of long-term assumptions that nobody can know for certain. That does not make DCF useless. It makes honest DCF work a matter of discipline: choose a modest terminal growth rate, tie growth to reinvestment, test your WACC, cross-check with an exit multiple, and always show a sensitivity table.
The next time you read a target price, look past the five years of forecasts and find the terminal value. That is where the valuation was really decided.
Disclaimer: This article is for education only and is not investment advice. Figures in the worked example are illustrative. Please consult a SEBI-registered investment adviser before making investment decisions.