
Free Cash Flow Yield vs P/E: Two Different Ways to Think About Equity Valuation
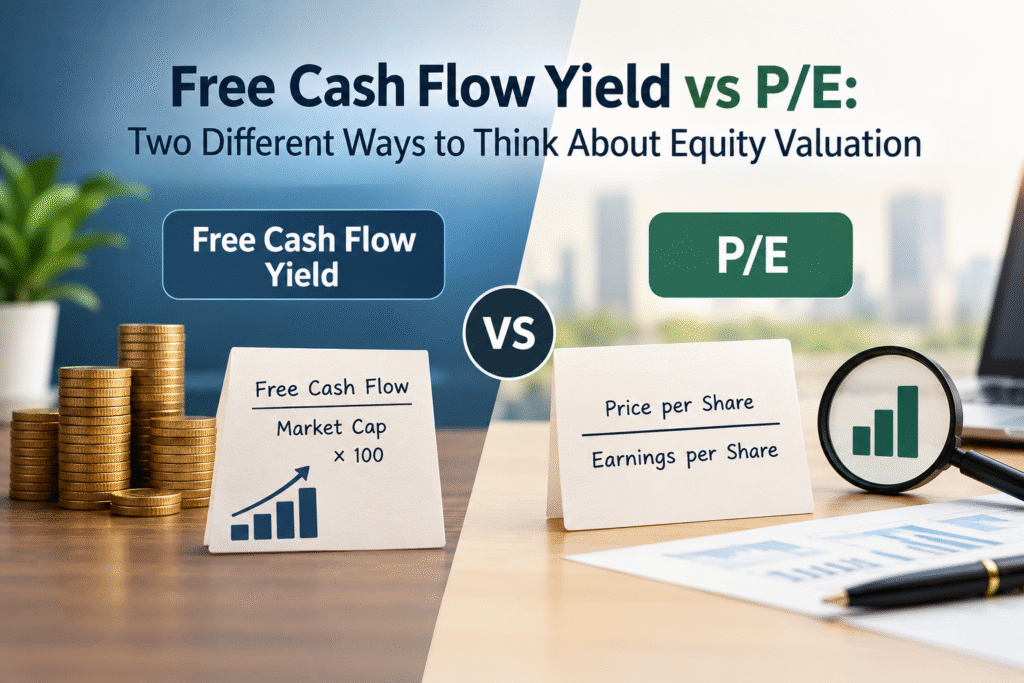
Free cash flow yield and the P/E ratio both tell you what you pay for a company’s earning power, but they measure two different things. The P/E ratio compares the share price with accounting profit. Free cash flow yield compares the market value of the company with the cash that is actually left over after the business pays its bills and funds its capital spending. A stock can look cheap on one measure and expensive on the other, and that gap is often where the real insight sits.
If you invest in Indian stocks, you have probably seen P/E on every stock screener and in every broker report. FCF yield gets less attention, yet many experienced investors treat it as a check on whether reported profit is turning into real money. This guide explains both ratios in plain language, shows how to calculate them, walks through a worked example, and tells you when to trust each one.
Key Takeaways
- The P/E ratio equals market price divided by earnings per share. It measures how many rupees you pay for one rupee of accounting profit.
- FCF yield equals free cash flow divided by market capitalisation. It measures how many rupees of spare cash the business generates for every 100 rupees of market value.
- Two companies with the same P/E can have very different FCF yields if one spends heavily on plant, machinery or working capital.
- P/E works well for stable, profitable and lightly capital-intensive businesses. FCF yield works better for capital-heavy businesses and for checking earnings quality.
- Neither ratio is enough alone. Use both, look at several years of data, and compare the result with growth, debt and the return you can earn from a government bond.
What Is the P/E Ratio?
The price to earnings ratio, usually written as P/E, is the most widely used valuation ratio in the stock market. The formula is simple:
P/E ratio = Market price per share / Earnings per share (EPS)
If a stock trades at ₹500 and the company earned ₹25 per share over the last twelve months, the P/E is 20. You are paying ₹20 for every ₹1 of annual profit.
There are two common versions. Trailing P/E uses earnings from the last four reported quarters. Forward P/E uses analyst estimates of earnings for the coming year. Trailing P/E is based on facts that have already happened, while forward P/E depends on forecasts that can turn out wrong.
The P/E ratio also has a mirror image called the earnings yield, which is earnings divided by price. A P/E of 20 gives an earnings yield of 5 percent. This is useful because it lets you compare a stock with other investments that quote a yield, such as a fixed deposit or a government bond.
For the broader market, the Nifty 50 P/E stood close to 19 on 23 October 2026, according to published NSE-based data. That sits below its five-year average of about 21.9 and its ten-year average of about 24.7. A P/E near 19 works out to an earnings yield of roughly 5.2 percent for the index as a whole.
Where the P/E Ratio Works Well
- It is quick to calculate and available for almost every listed company.
- It allows easy comparison between companies in the same sector, such as two private banks or two FMCG makers.
- It works well for mature companies with steady profits and modest capital needs.
- It reflects what the market expects for growth, since faster-growing companies usually carry higher P/E ratios.
Where the P/E Ratio Falls Short
- Net profit is an accounting number. It includes non-cash items such as depreciation and can include one-time gains that will not repeat.
- It says nothing about how much cash the company must reinvest to keep growing or even to stay in business.
- It does not show debt. Two companies with the same P/E can carry very different levels of borrowing.
- It cannot be used when earnings are negative, which is common for young or turnaround companies.
- Management has some freedom in how profit is reported, which means two similar companies can show different earnings from the same cash business.
What Is Free Cash Flow Yield?
Free cash flow, often shortened to FCF, is the cash a company generates after paying for the capital spending needed to run and grow the business. You can find the numbers in the cash flow statement in the annual report.
Free cash flow = Cash flow from operations – Capital expenditure
FCF yield then compares that cash with what the market is paying for the company.
FCF yield = Free cash flow / Market capitalisation x 100
If a company has a market capitalisation of ₹10,000 crore and generates ₹500 crore of free cash flow, the FCF yield is 5 percent. For every ₹100 you pay for the whole business, the business produces ₹5 of cash that could go to shareholders as dividends, buybacks or debt repayment, or could stay in the company for future growth.
You may also see this ratio written the other way around as price to free cash flow, or P/FCF. A 5 percent FCF yield equals a P/FCF of 20. It is the same information in a different form, just as earnings yield and P/E are two views of one idea.
Equity FCF Yield and Enterprise Value FCF Yield
There are two ways to build the ratio, and mixing them up leads to wrong answers.
- Equity FCF yield uses free cash flow to equity (after interest payments and debt repayments) divided by market capitalisation. This answers the question of what the shareholders’ share of the cash is.
- Enterprise value FCF yield uses free cash flow before interest (also called unlevered free cash flow) divided by enterprise value, which is market capitalisation plus net debt. This lets you compare companies with different levels of debt on equal terms.
For a quick check on a company with little debt, the simple version with operating cash flow minus capital expenditure and market capitalisation is usually good enough. For a company with heavy borrowing, the enterprise value version gives a fairer picture.
Where FCF Yield Works Well
- It focuses on cash, which is harder to dress up than reported profit.
- It captures the cost of capital spending, so it treats a cement maker and a software firm fairly.
- It helps you spot companies whose profit looks healthy but whose cash flow is weak.
- It connects directly to what a business can pay back to its owners over time, which is the basis of discounted cash flow valuation.
Where FCF Yield Falls Short
- Free cash flow is lumpy. A big capacity expansion in one year can push FCF close to zero or below, even for a healthy company.
- Not all capital spending is equal. Money spent to maintain existing capacity is a true cost. Money spent on growth projects may pay off for years.
- Changes in working capital, such as a sudden build-up of inventory or receivables, can swing a single year’s number.
- It is difficult to apply to banks and NBFCs, because lending is part of their core operations and shows up in operating cash flow in a confusing way.
FCF Yield vs P/E: Side-by-Side Comparison
| Feature | P/E Ratio | FCF Yield |
|---|---|---|
| What it uses | Accounting profit (EPS) | Actual cash after capital spending |
| Formula | Price / EPS | FCF / Market cap |
| Reflects capital spending | No | Yes |
| Affected by depreciation policy | Yes | Much less |
| Easy to find | Very easy | Needs the cash flow statement |
| Works for banks and NBFCs | Yes | Poorly |
| Works for loss-making firms | No | Only if FCF is positive |
| Stability year to year | Fairly stable | Often lumpy |
| Best for | Mature, profitable, stable firms | Capital-heavy firms and earnings quality checks |
A Worked Example: Same P/E, Very Different Cash
The figures below are made-up numbers used only to show the idea. They are not real companies.
Imagine two companies that each have a market capitalisation of ₹1,00,000 crore and report a net profit of ₹5,000 crore.
Company A is an asset-light services business.
- Net profit: ₹5,000 crore
- Cash flow from operations: ₹5,500 crore
- Capital expenditure: ₹500 crore
- Free cash flow: ₹5,000 crore
- P/E: 20
- FCF yield: 5 percent
Company B is a capital-heavy manufacturer.
- Net profit: ₹5,000 crore
- Cash flow from operations: ₹6,000 crore
- Capital expenditure: ₹4,500 crore
- Free cash flow: ₹1,500 crore
- P/E: 20
- FCF yield: 1.5 percent
On P/E alone, both companies look identical. Both trade at 20 times earnings. But Company A turns almost every rupee of profit into free cash, while Company B turns only 30 paise of each rupee of profit into free cash, because it must keep spending on plant and machinery.
This is why FCF yield matters. If you were buying the whole business, you would care about the cash it hands back to you, not the profit shown in the income statement. Company B is not necessarily a bad investment. If its capital spending is building new capacity that will lift profit sharply in future years, the low FCF yield today may be a fair price for growth. But you should know that is the bet you are making.
A useful number to calculate here is the FCF conversion ratio, which is free cash flow divided by net profit. Company A has a conversion of 100 percent. Company B has 30 percent. A ratio that stays well below 100 percent for many years is a reason to look closer.
Why P/E and FCF Yield Often Disagree
When the two ratios give different signals, one of a handful of reasons is usually behind it.
1. Capital intensity. Businesses such as steel, cement, power, telecom and infrastructure must keep investing heavily. Their profit looks better than their free cash flow.
2. Depreciation versus actual capital spending. Depreciation is a book entry that spreads the cost of an asset over many years. If a company spends far more on new assets than it records as depreciation, profit will overstate the cash available.
3. Working capital. A company that grows by selling on long credit can report rising profit while its cash gets stuck in receivables. This shows up in lower operating cash flow.
4. One-time items. Profit from selling an asset or a tax write-back inflates EPS in one year but does not repeat. It also does not always bring cash.
5. Share-based pay. Many listed companies pay employees in shares or stock options. This expense reduces profit but does not reduce cash, so FCF can look better than the true cost to shareholders. Check how much of it exists.
6. Debt and interest. Equity FCF is calculated after interest, while some profit figures are not. Heavy borrowing can make both ratios look better than the risk deserves.
When to Lean on the P/E Ratio
Use P/E as your main tool when you look at:
- Banks, NBFCs and insurers, where free cash flow is not meaningful
- Mature consumer companies with steady margins and low capital needs
- Quick comparisons within one sector
- The broad market, using an index such as the Nifty 50
Even here, compare the current P/E with the company’s own five-year and ten-year range, and with its peers. A P/E of 25 may be cheap for a company that has historically traded at 40, and expensive for one that has historically traded at 15.
When to Lean on FCF Yield
Use FCF yield as your main tool when you look at:
- Capital-heavy businesses such as metals, cement, power, oil and gas, and telecom
- Companies where profit has grown but cash has not
- Mature cash-generating businesses that return money through dividends and buybacks
- Cases where you suspect aggressive accounting
A healthy sign is a company whose free cash flow stays close to or above net profit over several years. A warning sign is a company that reports rising profit year after year while free cash flow stays flat or turns negative.
How to Use Both Ratios Together: A Simple Process
You do not need to pick a winner. A short checklist helps you use both.
- Find the P/E and convert it to earnings yield. Divide 1 by the P/E. A P/E of 25 gives 4 percent.
- Calculate the FCF yield using the last twelve months and also the average of the last five years, to smooth out lumpy years.
- Compare the two yields. If FCF yield is close to earnings yield, profit is turning into cash. If FCF yield is much lower, find out why.
- Separate maintenance capital spending from growth spending. Read the management commentary in the annual report. Growth spending that earns a good return is not a problem.
- Check debt. Look at net debt to operating profit and interest cover. High debt weakens both ratios.
- Compare with a risk-free return. Put the yield next to the current 10-year government bond yield. An equity yield only slightly above the bond yield leaves little reward for the extra risk, unless strong growth is likely.
- Check growth and return on capital. A lower yield can be fair for a company that is growing cash flow quickly and earning high returns on the money it reinvests.
Common Mistakes to Avoid
- Using a single year of free cash flow. One big capital project can distort the number. Use a five-year average.
- Treating a high FCF yield as proof of a bargain. A high yield can signal that the market expects cash flow to fall. Always ask why the yield is high.
- Ignoring negative free cash flow in growing companies. Negative FCF is not always bad, but it needs a clear story about when and how cash will turn positive.
- Comparing across very different sectors. A telecom company and a software company will not have the same normal range for either ratio.
- Mixing equity and enterprise value versions. Divide equity cash flows by market capitalisation and unlevered cash flows by enterprise value. Do not cross them.
- Forgetting that both ratios look backward. Both use past numbers. The share price today reflects what the market expects for the future.
Frequently Asked Questions
What is a good FCF yield?
There is no single number that works for every company. A common starting test is whether the FCF yield is clearly higher than the 10-year government bond yield, and whether it is higher than the company’s own historical average. A yield that is stable or rising over several years is more reassuring than a high number from a single year.
Is FCF yield better than the P/E ratio?
Neither is better in every case. P/E is simpler and works well for stable, profitable companies and for banks. FCF yield gives a more honest view for capital-heavy businesses and for testing the quality of reported profit. Most careful investors use both.
How is FCF yield different from earnings yield?
Earnings yield is net profit divided by market capitalisation, which is the same as 1 divided by the P/E ratio. FCF yield replaces net profit with free cash flow. The difference between the two tells you how much of the profit is being absorbed by capital spending and working capital.
Can FCF yield be negative?
Yes. If a company spends more on capital projects than it earns from operations, free cash flow is negative and so is the yield. This is common for young companies and for firms in a heavy expansion phase. It needs a clear explanation before you treat it as acceptable.
What is price to free cash flow?
Price to free cash flow, or P/FCF, is market capitalisation divided by free cash flow. It is the reverse of FCF yield. A P/FCF of 25 equals an FCF yield of 4 percent.
Can I use FCF yield for banks and NBFCs?
It is not a good fit. For lenders, loans and deposits move through operating cash flow, so free cash flow does not carry the same meaning as it does for a manufacturer. Investors usually value banks and NBFCs using P/E, price to book value and return on equity.
Where can I find free cash flow data for Indian companies?
The cash flow statement in a company’s annual report is the original source. Stock screening websites also publish cash flow data and calculate ratios for listed Indian companies. Check the numbers against the annual report if a figure looks unusual.
What is the difference between FCF yield and dividend yield?
Dividend yield counts only the cash actually paid out to shareholders. FCF yield counts the cash that is available to be paid out. A company can have a high FCF yield and a low dividend yield if it keeps cash for growth or buys back shares.
Final Thoughts
The P/E ratio and FCF yield are two ways of asking the same basic question: how much am I paying for what this business earns? P/E answers it using accounting profit. FCF yield answers it using cash. When both point the same way, your confidence in the valuation grows. When they disagree, you have found something worth investigating, whether that is heavy capital spending, a working capital problem, or a one-time gain.
Before you buy a stock, calculate both. Look at five years of data, not one. Read why the numbers differ. That habit alone will help you avoid some of the most common valuation mistakes.
Disclaimer: This article is for education and general information only. It is not investment advice or a recommendation to buy or sell any security. The company figures in the worked example are made up for illustration. Market data quoted for the Nifty 50 is approximate and changes daily. Please do your own research or speak to a SEBI-registered investment adviser before making investment decisions.