
Credit Risk vs Interest-Rate Risk: Decomposing Bond Portfolio Performance
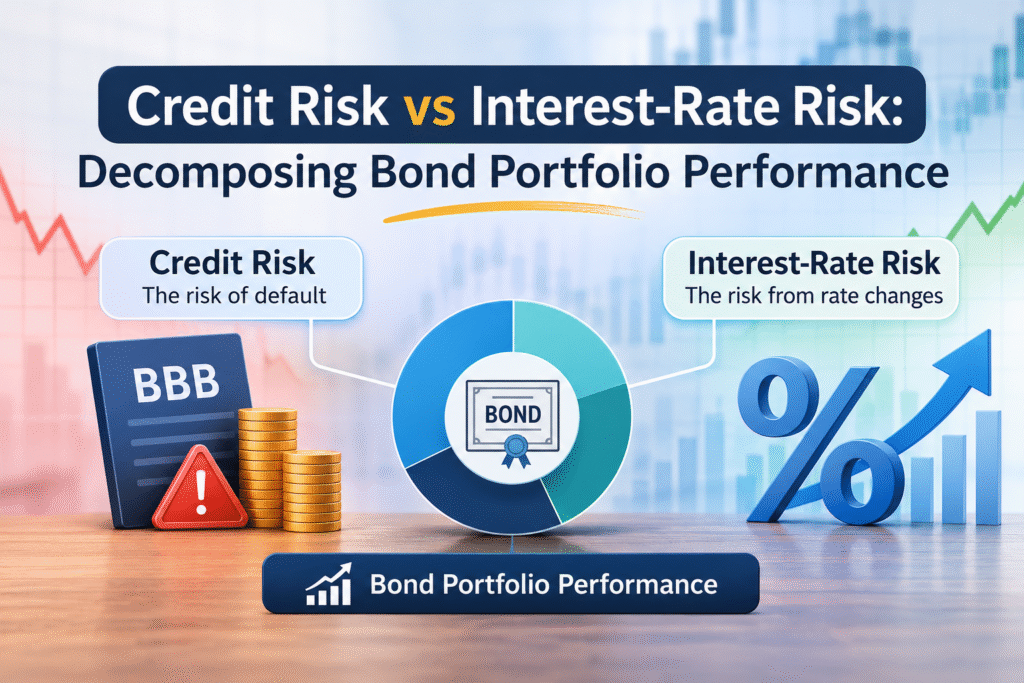
Most investors look at one number when they check a bond fund or a bond portfolio: the return. It went up, it went down, or it did a little of both. What the number does not tell you is why. Was the return driven by interest rates moving, by the credit quality of the issuers changing, or simply by the interest income you collected along the way?
That question matters more than it looks. Two debt funds can show the same 1-year return and carry completely different risks underneath. One may have earned it by taking duration risk. The other may have earned it by holding lower-rated papers that pay a higher yield. If you do not know which is which, you cannot tell whether the next year will look the same.
In this guide, we break down credit risk vs interest-rate risk, explain how each one affects bond prices, and show how to decompose bond portfolio performance into its real drivers. We keep the language simple and use Indian examples wherever they help.
Quick Answer: Credit Risk vs Interest-Rate Risk
Interest-rate risk is the risk that bond prices fall when market interest rates rise. It affects almost every bond, including government securities (G-Secs). Credit risk is the risk that the issuer of the bond will not pay interest or principal on time, or that the market will price in a higher chance of that happening. It affects corporate bonds, NBFC papers, and other non-government debt.
In short, interest-rate risk comes from the market. Credit risk comes from the borrower.
What Is Interest-Rate Risk?
Bond prices and interest rates move in opposite directions. When the RBI raises the repo rate and yields in the market go up, existing bonds with lower coupons become less attractive, so their prices fall. When rates come down, those same bonds become more valuable and their prices rise.
This is also called market risk or rate risk, and it applies even to a bond with zero chance of default, such as a Central Government security. A 10-year G-Sec will not default, but its price can still swing sharply if yields move.
How Duration Measures Interest-Rate Risk
The standard tool to measure interest-rate risk is duration. There are two versions you will often see.
Macaulay duration is the weighted average time, in years, it takes to receive all the cash flows of a bond.
Modified duration tells you the approximate percentage change in the bond price for a 1 percent change in yield. This is the one most investors actually use.
A simple example: if a debt fund has a modified duration of 4 years and yields rise by 1 percent, the fund’s net asset value (NAV) falls by roughly 4 percent. If yields fall by 1 percent, the NAV rises by roughly 4 percent. The longer the duration, the bigger the swing.
Professionals also use DV01 (dollar value of one basis point), which tells you how much money you gain or lose for every 0.01 percent move in yield. It is the same idea as duration, just expressed in rupees instead of percentage.
Convexity: The Second Layer
Duration is a straight-line estimate, and the real price-yield relationship is curved. Convexity measures that curve. For larger yield moves, duration alone overstates losses when rates rise and understates gains when rates fall. A bond with higher convexity holds up better in both directions. For most retail investors, duration does most of the work, but convexity explains why the maths is never perfectly exact.
What Is Credit Risk?
Credit risk, also called default risk, is the chance that a bond issuer fails to make a payment of interest or principal. It also covers the chance that the issuer’s credit rating gets downgraded, which pushes the bond price down even without an actual default.
In India, credit rating agencies such as CRISIL, ICRA, CARE and India Ratings grade bonds from AAA (highest safety) down to D (default). A AAA-rated bond from a strong public sector company carries very low credit risk. A BBB or lower-rated bond from a smaller company carries a lot more.
Credit Spread: The Price of Credit Risk
Investors do not take credit risk for free. They ask for extra yield over the risk-free government bond of similar maturity. That extra yield is called the credit spread.
If a 5-year G-Sec yields 7 percent and a 5-year AA-rated corporate bond yields 8.5 percent, the credit spread is 1.5 percent, or 150 basis points. When the market gets nervous about the economy or about a sector, spreads widen and corporate bond prices fall. When confidence returns, spreads tighten and prices recover.
This is why we say spread widening is the main way credit risk shows up in a portfolio day to day, long before any actual default happens.
Spread Duration
Just as duration measures sensitivity to interest rates, spread duration measures how much a bond’s price changes when its credit spread changes. A bond with a spread duration of 3.5 will lose about 3.5 percent in price if its spread widens by 1 percent. For a portfolio of only government bonds, spread duration is zero, because there is no credit spread to move.
Credit Risk vs Interest-Rate Risk: Key Differences
Here is how the two compare on the points that matter most to a retail investor.
| Point | Interest-Rate Risk | Credit Risk |
|---|---|---|
| What causes it | Changes in market interest rates, RBI policy, inflation | Issuer’s ability to repay, rating changes, economic stress |
| Who it affects | Nearly all bonds, including G-Secs | Mainly corporate bonds, NBFC and lower-rated papers |
| How it is measured | Modified duration, DV01, convexity | Credit rating, credit spread, spread duration |
| Worst case | Large NAV fall when yields spike | Default, with partial or full loss of capital |
| Can you diversify it away | Only by changing duration | Yes, to a good extent, by holding many issuers |
| Typical reward | Capital gains when rates fall | Higher yield through the credit spread |
There is also a link between the two. In a weak economy, interest rates often fall while credit spreads widen. The two effects can offset each other in a mixed portfolio, which is exactly why you need to separate them to understand what is going on.
How to Decompose Bond Portfolio Performance
Return decomposition, also called performance attribution, splits the total return of a bond portfolio into the pieces that created it. For a basic fixed income portfolio, the main pieces are these.
- Income return (carry): The coupon interest the portfolio earns, plus the accrual of any discount on the bonds. This is the steady part. It is often described through yield to maturity (YTM).
- Interest-rate effect: The price gain or loss caused by a shift in government bond yields. Duration drives this.
- Credit spread effect: The price gain or loss caused by a change in credit spreads. Spread duration drives this.
- Roll-down effect: The small gain as a bond ages and moves down a normal upward-sloping yield curve, so it is priced at a lower yield.
- Default and downgrade losses: Actual losses from issuer failures or rating cuts, if any.
- Costs: The expense ratio and trading costs that reduce the net return.
A practical formula used in simple attribution looks like this:
Total return ≈ Income return − (Duration × Change in government yield) − (Spread duration × Change in credit spread) + Roll-down − Default losses − Costs
A Worked Example
Take a corporate bond portfolio over one year with these numbers.
- Portfolio yield (income return): 7.5 percent
- Modified duration: 4 years
- Spread duration: 3.5 years
- Government bond yields rise by 0.50 percent
- Credit spreads widen by 0.30 percent
- No defaults
Now work out each piece.
- Income return: +7.50 percent
- Interest-rate effect: −4 × 0.50 = −2.00 percent
- Credit spread effect: −3.5 × 0.30 = −1.05 percent
- Default losses: 0 percent
Total return is roughly 7.50 − 2.00 − 1.05 = 4.45 percent, before costs.
Now look at what that tells you. The headline return of about 4.45 percent looks fine at first glance. But the breakdown shows that the portfolio gave up more than 3 percent to market moves. If rates and spreads had stayed flat, the return would have been close to 7.5 percent. And if rates had fallen instead, it could have been much higher. The portfolio’s return was driven far more by market movements than by skill or by the bonds themselves.
This is the real value of decomposing bond returns. It shows you where the risk is, not only where the profit was.
Why This Matters for Indian Investors
Indian debt mutual fund investors face both risks, and the mix changes a lot from one fund category to another.
- Gilt funds and long duration funds carry high interest-rate risk and almost no credit risk. They move with RBI policy and G-Sec yields.
- Liquid funds, overnight funds and money market funds carry very little of either risk because of their short maturities and high-quality holdings.
- Corporate bond funds hold mostly AAA-rated papers, so credit risk is lower, but they still carry moderate duration risk.
- Credit risk funds deliberately hold lower-rated bonds to earn higher yield. They carry higher credit risk and should be treated with care.
- Banking and PSU debt funds sit in the middle, with good credit quality and moderate interest-rate risk.
The 2018 IL&FS default and the 2020 Franklin Templeton episode were hard reminders that credit risk is real in Indian debt markets, not just a textbook idea. Investors who chased the extra yield of lower-rated papers without understanding the risk learned this the expensive way. SEBI’s Potential Risk Class (PRC) matrix, which shows each debt scheme’s maximum credit risk and interest-rate risk on a simple grid, was introduced to help investors see this at a glance.
How to Manage Credit Risk and Interest-Rate Risk
You cannot remove both risks, but you can choose which one you want to carry and how much.
To manage interest-rate risk:
- Match the duration of your debt investment to your holding period. If you need the money in 2 years, a fund with a duration of 7 years is the wrong fit.
- Keep shorter duration when you expect rates to rise, and increase duration when you expect rates to fall. Be careful, as nobody predicts rate moves consistently.
- Use a bond ladder, where you hold bonds maturing in different years, to smooth out the impact of rate changes.
To manage credit risk:
- Stick to high credit quality, such as AAA-rated papers and government securities, for the core of your portfolio.
- Diversify across many issuers and sectors, so one default does not hurt too much.
- Read the fund’s portfolio, not only its past return. Check the rating mix and how much sits in AA or lower.
- Be cautious when a bond or fund offers a yield far above its peers. The extra yield is the market’s price for extra risk.
Common Mistakes Investors Make
- Judging a debt fund only by its 1-year return. A high return may only mean the fund took more risk and it happened to pay off.
- Assuming debt funds are risk-free. Debt does not mean safe. Both risks are real.
- Ignoring duration. Many retail investors do not know their fund’s duration, even though it is the best single indicator of rate sensitivity.
- Chasing yield. A higher YTM usually means higher credit risk, longer duration, or both.
- Mixing up credit rating and safety guarantee. A rating is an opinion, and it can be wrong or can change.
Frequently Asked Questions
What is the difference between credit risk and interest-rate risk?
Interest-rate risk is the chance of losing bond value when market interest rates rise. Credit risk is the chance of losing money because the issuer fails to pay or its credit quality gets worse. The first comes from the market, and the second comes from the borrower.
Which is riskier, credit risk or interest-rate risk?
It depends on the bond and on the time frame. Government bonds carry no credit risk but can fall sharply if yields rise. Low-rated corporate bonds can lose most of their value in a default, which is a bigger permanent loss. For most investors, credit risk is the one that can cause permanent loss, while interest-rate risk is usually temporary if the bond is held to maturity.
Do government bonds have credit risk?
Indian government securities are treated as having negligible credit risk because the government can meet obligations in its own currency. They still carry full interest-rate risk.
What is duration in simple words?
Duration tells you how much a bond or a bond fund will rise or fall in price for each 1 percent change in interest rates. A duration of 3 means about a 3 percent price change for a 1 percent move in yield.
What is a credit spread?
A credit spread is the extra yield a corporate bond pays over a government bond of similar maturity. It is the market’s price for taking credit risk.
How do you calculate bond portfolio performance attribution?
Split the total return into income return, interest-rate effect, credit spread effect, roll-down, default losses and costs. Estimate the rate effect with duration and the spread effect with spread duration, as shown in the worked example above.
Can a bond fund lose money if there is no default?
Yes. If interest rates rise or credit spreads widen, the NAV of a bond fund can fall even when every bond is paying on time.
How can I check the risk of my debt mutual fund?
Look at the fund’s modified duration, average maturity, YTM, and credit rating breakdown in the monthly factsheet. Also check the SEBI Potential Risk Class (PRC) matrix for the scheme.
Final Thoughts
Bond returns are never one number. They are a mix of income, interest-rate moves, credit spread changes, and sometimes losses from defaults. Once you learn to separate these pieces, you stop being surprised by what your debt portfolio does.
Before you invest in any bond or debt fund, ask two questions. How much will it lose if interest rates rise, and how much will it lose if the credit quality of its holdings slips? If you can answer both, you understand the investment.
Disclaimer: This article is for educational purposes only and is not investment advice. Debt funds and bonds are subject to market risk, interest-rate risk and credit risk. Please read all scheme-related documents carefully and consult a SEBI-registered advisor before investing.