
Credit Spreads: How Markets Price Corporate Default Risk
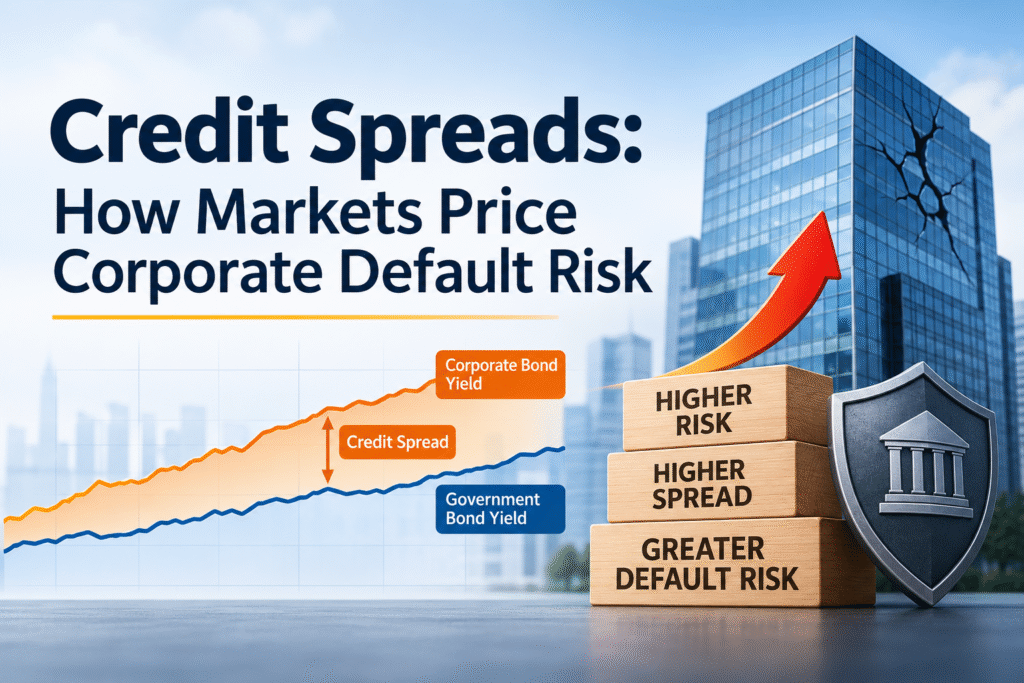
A credit spread is the extra yield a corporate bond pays over a risk-free government bond of the same maturity. It is the market’s price for the chance that a company will fail to pay you back. If a 10-year government security yields 6.89% and a 10-year AAA corporate bond yields 7.49%, the credit spread is 0.60%, or 60 basis points.
That one number tells you a great deal. It shows how worried bond investors are about a company, a sector or the whole economy, and it moves every day. This guide explains the meaning of a credit spread, the credit spread formula, what the spread pays you for, how it behaves across rating grades in India and the US, and how to read it before you buy a bond or a debt mutual fund.
What Is a Credit Spread?
Every bond has a yield. The yield on a government security (G-Sec) is treated as the risk-free rate, because the government can always meet rupee obligations. A company has no such backing, so investors ask for more yield to lend to it. The gap between the two yields is the credit spread.
The credit spread formula is simple:
Credit Spread = Corporate Bond Yield − Government Bond Yield (same maturity)
Spreads are quoted in basis points. One basis point (bps) is 0.01%, so 100 bps equals 1%.
Here is what 60 bps means in rupees. Suppose you invest ₹10,00,000 in the 10-year AAA bond above. The extra yield over the G-Sec is 0.60%, or about ₹6,000 a year. That ₹6,000 is your payment for taking company risk instead of government risk. Whether it is enough depends on how likely the company is to default, which is exactly the question the market is trying to answer.
What the Spread Actually Pays You For
A credit spread is not pure default insurance. It bundles several things together.
Expected loss from default. This is the core piece. A rough way to write it is:
Expected Loss ≈ Probability of Default × Loss Given Default
Take a bond where the market sees a 2% chance of default each year. If bondholders usually recover 40 paise on the rupee after a default, the loss given default is 60%. Expected loss is then 2% × 60% = 1.2% a year, or 120 bps. On ₹10,00,000, that is ₹12,000 a year of expected loss.
A risk premium. Defaults come in clusters, during recessions, when your salary and your other investments are also under pressure. Investors want extra pay for holding an asset that fails at bad times. Because of this, real-world spreads are usually wider than expected loss alone. Researchers call this gap the credit spread puzzle.
Liquidity. Many Indian corporate bonds trade rarely. If you cannot sell quickly at a fair price, you need extra yield to accept that. Long-dated AA paper is a good example, where thin trading can move the spread even when nothing has changed in the company.
Tax and other features. Call options, subordination and the issuer’s structure all feed into the price. Interest on corporate bonds is also taxed at your slab rate, which affects what you actually keep.
So when you see a wide spread, it means the market sees higher default risk, lower liquidity, or both.
How Markets Price Corporate Default Risk
Nobody sets a credit spread by decree. It comes out of thousands of buy and sell decisions. A few forces drive it.
Credit ratings. Agencies such as CRISIL, ICRA, CARE Ratings and India Ratings grade issuers from AAA down to D. A downgrade almost always pushes the spread wider, because the bond now carries more risk. Markets often move before the agency does, so a widening spread can be an early warning that a rating cut may follow.
Company fundamentals. Falling cash flows, rising debt, weak interest cover and promoter pledging all raise the default probability that investors build into the price.
The distance to default. A useful mental picture comes from the Merton model, a classic idea in finance. A company’s shareholders hold something like a call option on the firm’s assets, and bondholders are effectively short a put option. When the value of the assets falls toward the value of the debt, the chance of default rises, and the spread widens quickly. That is why spreads rise slowly at first and then jump when a company gets close to trouble.
The economic cycle. In a slowdown, more firms are expected to miss payments, so spreads widen across the board. In a boom, the opposite happens.
Supply, demand and liquidity. Heavy bond issuance, a pullback by mutual funds, or a rush out of credit funds can widen spreads without any change in company health.
Common Ways to Measure a Credit Spread
Professionals use a few versions of the number. They differ in the benchmark they compare against.
| Measure | What it compares | Typical use |
|---|---|---|
| G-spread | Bond yield minus a government bond yield of similar maturity | Simple, widely quoted in India |
| I-spread | Bond yield minus the swap rate of similar maturity | Used where swap curves are liquid |
| Z-spread | Constant spread added to the whole government curve that prices the bond | More exact than G-spread |
| Option-adjusted spread (OAS) | Z-spread after removing the value of embedded options | Standard for bonds with call or put features |
| Credit default swap (CDS) spread | Annual cost of insuring a bond against default | Direct market price of default risk |
A credit default swap works like an insurance contract. The buyer pays a yearly premium, and the seller pays out if the borrower defaults. The CDS spread is that premium, quoted in basis points. India has a framework for corporate bond CDS, but trading activity is limited, so Indian investors mostly rely on G-spreads and ratings.
Credit Spreads Across Rating Grades: Real Numbers
Spreads do not grow in a straight line as ratings fall. They rise slowly through the top grades and then climb steeply.
India (as of 17 July 2026). Data from the ICRA Analytics daily fixed income tracker shows these spreads over G-Secs of the same maturity:
- 10-year AAA: about 60 bps
- 10-year AA: about 138 bps
- 3-year AAA: about 97 bps
- 3-year AA: about 173 bps
The shorter AA bond pays a wider spread than the 10-year AA bond, which is a reminder that the shape of the spread curve can change from one maturity to the next. Always compare bonds of the same maturity and the same type of issuer.
United States (late October 2026). Federal Reserve Bank of St. Louis (FRED) data on ICE BofA indices shows:
- Investment grade corporate bonds: roughly 82 bps in early October
- High yield (BB and below): 3.30%, or 330 bps, on 26 October, up from about 2.63% in late August
- CCC and lower: above 13%, as of 22 October
The pattern is the point. A high yield index at 330 bps can look calm, while the weakest borrowers in the CCC bucket are priced at more than 13%. The market is separating strong credits from weak ones, and that gap is itself a signal. A single headline spread can hide a lot of stress underneath.
Figures change daily. Check the latest data before you act on them.
What Widening and Tightening Spreads Tell You
When spreads widen, investors are demanding more pay for credit risk. It can mean worry about growth, tighter funding, or trouble in one sector. Widening spreads have often come before or alongside recessions.
When spreads tighten, investors feel safe and are willing to accept little extra yield. Tight spreads leave less cushion if something goes wrong, so buying when spreads are very narrow means you are paid less for the same risk.
History shows how sharp the moves can be. The US high yield spread went above 20% during the 2008 financial crisis and reached close to 11% in March 2020 at the start of the pandemic, compared with a few percentage points in calm years. India has had its own stress episodes. The 2018 IL&FS default shook trust in non-bank lenders, and in April 2020 Franklin Templeton India wound up six debt schemes after redemption pressure hit its credit-heavy portfolios. In both cases, spreads on weaker issuers jumped and liquidity dried up.
Why a Wide Spread Is Not Free Money
A bond offering 10% when a G-Sec offers 7% looks generous. The question is why it is so generous. A wide spread is the market telling you the risk is higher. Three mistakes are common.
- Chasing yield without checking the issuer. The extra return is a payment for risk. If the company defaults, you can lose far more than you earned in extra interest.
- Ignoring recovery. Unsecured and subordinated bonds can pay out very little after a default. Secured bonds usually recover more.
- Forgetting exit risk. In a stress period, a thinly traded bond may not find a buyer at a fair price. This is a real problem for retail investors holding individual bonds.
A better habit is to compare the spread with the bond’s own history and with similar issuers. A 150 bps spread on an AA bond may be reasonable. The same spread on a AAA bond could be a sign that something has changed.
Credit Spread in Options Trading: A Different Meaning
If you searched for “credit spread” and landed here, note that the phrase has a second meaning in derivatives. In options trading, a credit spread is a strategy where you sell one option and buy another of the same type and expiry at a different strike, and you receive a net premium (a credit) when you open the trade.
Take a hypothetical bull put spread on an index. You sell a put at a strike of 24,000 for ₹150 and buy a put at 23,800 for ₹100. Your net credit is ₹50 per unit. If the index stays above 24,000 at expiry, you keep the full ₹50. Your maximum loss is the strike gap minus the credit, which is 200 − 50 = ₹150 per unit, and it applies if the index falls below 23,800.
This is a different idea from a bond credit spread, even though the name is the same. Options strategies carry real risk and margin requirements, so understand them fully before trading.
How Indian Investors Can Use Credit Spreads
You do not need to be a bond trader to benefit from reading spreads.
- Compare like with like. Match the maturity, the rating and the type of issuer. A 3-year bond and a 10-year bond cannot be compared on spread alone.
- Check the rating and the outlook. Look at the rating rationale on the agency’s website, not just the letter grade. A negative outlook is worth noting.
- Look at the trend. A spread that has been widening for months deserves more attention than its current level.
- Know what your debt fund holds. Credit risk funds hold lower-rated bonds in exchange for higher yields. Read the portfolio, check the share of AA and below, and match the fund to your risk appetite.
- Spread your money. Do not put a large share of your savings in the paper of a single company, no matter how attractive the yield.
- Think about taxes. Interest on bonds is added to your income and taxed at your slab rate, so compare yields after tax.
Key Takeaways
- A credit spread is the yield on a corporate bond minus the yield on a government bond of the same maturity.
- It is quoted in basis points, where 100 bps equals 1%.
- The spread pays for expected default loss, a risk premium, liquidity and other features.
- Spreads rise slowly through the top ratings and steeply as ratings fall.
- Widening spreads signal rising worry about credit risk, and tight spreads mean thin compensation for that risk.
- A very wide spread is a warning as much as an opportunity.
Frequently Asked Questions
What is a credit spread in simple words?
A credit spread is the extra interest a company pays over the government to borrow money. It compensates the lender for the risk that the company may not repay.
How do you calculate a credit spread?
Subtract the yield on a government bond from the yield on a corporate bond of the same maturity. If the corporate bond yields 7.49% and the G-Sec yields 6.89%, the spread is 0.60%, or 60 bps.
What does a widening credit spread mean?
It means investors want more compensation for credit risk. This can be due to worry about the economy, a sector, or a specific company. Widening spreads often come before higher defaults.
What is a good credit spread?
There is no single good number. A fair spread depends on the rating, the maturity and market conditions. A spread that looks high for a AAA bond may look low for a BBB bond.
What is the difference between a credit spread and a CDS spread?
A credit spread is measured from bond yields. A CDS spread is the annual premium to insure against default on that borrower’s debt. In liquid markets the two usually move together.
Why do AA bonds have wider spreads than AAA bonds?
AA issuers are seen as slightly more likely to default and their bonds usually trade less often. Investors ask for more yield to cover both. In July 2026, the gap on 10-year bonds in India was roughly 78 bps.
Are credit spreads a recession indicator?
They can be one of several. Sharp widening in high yield spreads has often appeared before or during economic downturns. It is not a perfect predictor, and spreads can also widen for market-specific reasons.
Disclaimer: This article is for general education and is not investment advice. Bond prices and spreads change daily, and you can lose money, including through issuer default. Speak to a SEBI-registered investment adviser before acting.