
Yield Curve Analysis: What Different Curve Shapes Tell Investors
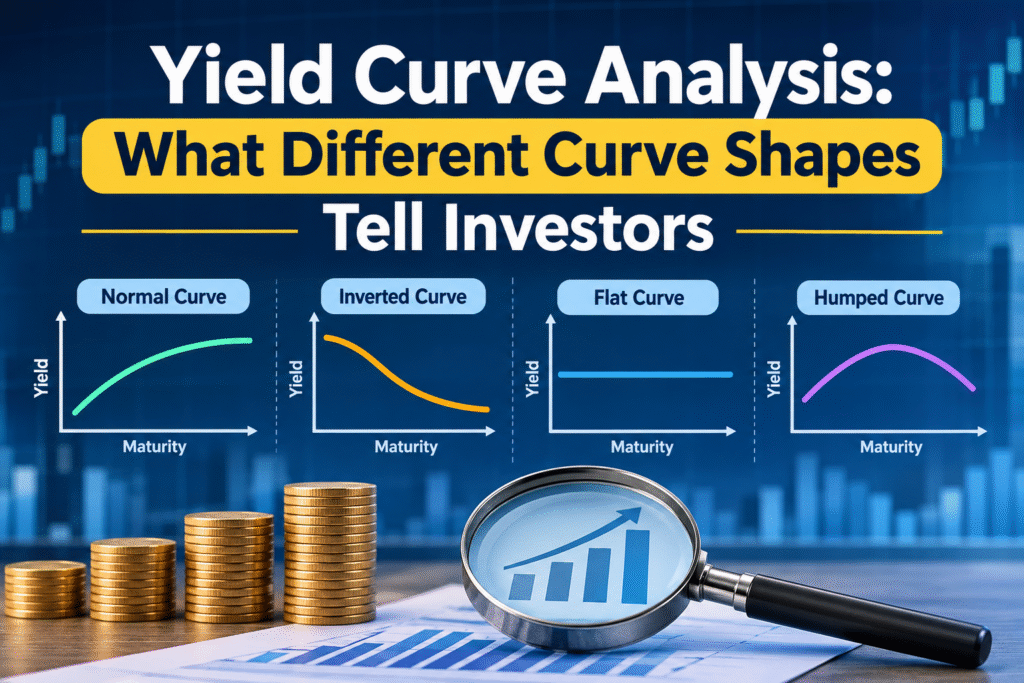
A yield curve is a line that plots the interest rates, or yields, on bonds of the same credit quality across different maturities, from three months to thirty years. Its shape (normal, steep, flat or inverted) shows what the bond market expects for economic growth, inflation and central bank policy. Reading it correctly helps investors judge interest-rate risk, recession risk and the cost of borrowing.
This guide explains how to read a yield curve, what each shape means, how the signal has performed in the past, and where the US and Indian curves stand right now.
Key Takeaways
- A normal yield curve slopes upward and usually points to steady growth.
- A steep yield curve often shows an early recovery, or worry about inflation and heavy government borrowing.
- A flat yield curve shows a market that is unsure and often marks a turning point in the rate cycle.
- An inverted yield curve, where short-term yields sit above long-term yields, has preceded most US recessions, but the timing varies a great deal.
- The curve is a probability signal, not a prediction. It works best alongside inflation, earnings and credit data.
- Indian investors can use the G-sec yield curve to choose debt fund duration, compare fixed deposits with bonds, and understand home loan rate direction.
What Is a Yield Curve and How Do You Read It?
Every bond pays interest, and the yield is the return an investor earns if the bond is bought at today’s price and held to maturity. A yield curve places those yields on a chart. The horizontal axis shows time to maturity. The vertical axis shows the yield.
Analysts nearly always use government bonds to draw the curve. In the United States, that means Treasury securities. In India, it means government securities, or G-secs. Government bonds carry almost no default risk in their own currency, so the only thing that changes along the curve is time. That makes the shape a clean reading of what investors want for lending money for longer.
The slope is simply the long-term yield minus the short-term yield. Two spreads are watched the most:
- 10-year minus 2-year (the 2s10s spread): the most quoted measure in market commentary.
- 10-year minus 3-month: the measure preferred in much of the academic research on recession forecasting, including work associated with the New York Federal Reserve.
A positive number means the curve slopes upward. A negative number means it is inverted.
Why Does the Yield Curve Have a Shape?
Three ideas explain most of what you see on the chart. They work together, and none of them is complete on its own.
1. The expectations theory. Long-term yields reflect the average of expected future short-term rates. If investors think the central bank will raise rates, long yields rise above short yields. If they expect rate cuts, long yields fall below short yields.
2. The liquidity preference or term premium idea. Lending for ten years carries more risk than lending for three months. Inflation can change, rates can move, and the bond price can fall. Investors ask for extra yield, called the term premium, to hold longer bonds. This is why the curve normally slopes up even when rates are expected to stay flat.
3. The market segmentation or preferred habitat idea. Some buyers prefer certain maturities. In India, insurance companies and pension funds need long-dated bonds to match long-term liabilities, while banks and money market funds focus on the short end. When demand or supply is heavy in one segment, the yield in that segment moves on its own.
The Four Main Yield Curve Shapes
| Curve shape | What it looks like | Common message from the market |
|---|---|---|
| Normal | Gentle upward slope | Steady growth and moderate inflation |
| Steep | Large gap between short and long yields | Early recovery, rising inflation worry, or heavy bond supply |
| Flat | Short and long yields almost equal | Late cycle, unsure direction, policy change ahead |
| Inverted | Short yields above long yields | Rate cuts expected, slowing growth feared |
1. Normal Yield Curve
A normal yield curve slopes upward at a modest angle. Short-term yields are lower than long-term yields, and the gap reflects the term premium. This is the shape you see most of the time in a healthy economy. It suggests that lenders expect growth and inflation to stay near normal levels, and that the central bank is not under pressure to move rates sharply.
For investors, a normal curve usually means that taking more duration risk is rewarded with more yield. Bank lending also works well in this setting, because banks borrow at short rates and lend at longer rates.
2. Steep Yield Curve
A steep yield curve has a wide gap between short and long yields. It usually appears in two situations.
The first is the early stage of a recovery. The central bank has cut short-term rates to support the economy, and investors expect growth and inflation to pick up, so long-term yields rise faster than short-term yields.
The second is a worry about inflation, government deficits or heavy bond issuance. In this case, buyers demand a higher term premium before they will lend for the long term. The steepness then reflects caution, not optimism.
The two cases look the same on a chart, so you need to check what is driving the move. A steep curve caused by falling short rates after a slowdown tells a different story from one caused by rising long-term yields on fiscal worry.
3. Flat Yield Curve
A flat yield curve means little extra yield for lending longer. It often appears late in a rate-hiking cycle, when the central bank has pushed short-term rates up and the market expects growth to slow. It can also appear when long-term yields fall because investors want safety.
A flat curve is a transition shape. It is neither a warning nor an all-clear. It shows that the market has stopped paying a premium for time, and the next move, either a steepening or an inversion, usually gives the clearer message.
4. Inverted Yield Curve
An inverted yield curve is the shape that gets the headlines. Short-term yields rise above long-term yields. The market is saying that current policy rates are high enough to slow the economy, and that rates will probably be cut later.
Inversion has been a reliable warning in the United States. Research from the Federal Reserve system has linked it to the recessions since the 1950s, with one widely noted false signal in the 1960s. The usual lead time runs from around six months to two years. In late 2022, the US 2-year yield was about 60 basis points above the 10-year yield, one of the deepest inversions since the 1980s.
A Note on the Humped Curve
Sometimes the curve rises in the middle and falls at the long end. This humped shape appears when the market expects short-term rates to climb for a while and then drop. It is less common, and it is usually treated as a variation of the flat or inverted case.
Steepening and Flattening: How the Curve Moves
Analysts also describe how the curve changes, not only what it looks like. Four terms appear often in bond research.
| Move | What happens | Typical cause |
|---|---|---|
| Bull steepener | Short yields fall faster than long yields | Central bank cuts rates or signals cuts |
| Bear steepener | Long yields rise faster than short yields | Inflation or fiscal worry, heavy bond supply |
| Bull flattener | Long yields fall faster than short yields | Growth fears, demand for safe assets |
| Bear flattener | Short yields rise faster than long yields | Central bank hikes or signals hikes |
“Bull” means yields are falling and bond prices are rising. “Bear” means yields are rising and bond prices are falling. The word “steepener” or “flattener” describes only the gap. This vocabulary helps you read bond market commentary and understand why a fund’s net asset value moved.
Does the Yield Curve Really Predict Recessions?
The honest answer is that it has a good record, but it is a signal and not a guarantee.
In its favour, the inversion has appeared before nearly every US recession in the post-war period. The logic is sound. When short rates are held above long rates, banks earn less on new lending, credit tightens and business investment slows.
Against it, the lead time is uneven, and the signal has become harder to use. The US 2-year and 10-year spread stayed negative for a record stretch after 2022. Kamakura’s weekly research noted that the run was the longest negative streak since the 2-year note was launched in 1976, and the streak ended on August 26, 2024. A long inversion with no quick recession was a reminder that this tool does not set a calendar.
Several things can distort the signal. Central bank bond purchases can push long yields down. Heavy government borrowing can push them up. Global demand for Treasuries, or for Indian G-secs from foreign investors, can move the long end for reasons unrelated to domestic growth. So a sensible analyst checks the curve against employment, inflation, credit spreads and corporate earnings before acting on it.
Where the US and Indian Curves Stand Now
Yield curves change every day, so treat the figures below as a snapshot from the last week of October 2026 and check current data before you decide anything.
United States. On October 23, 2026, the US Treasury curve showed a 3-month yield of 4.22%, a 2-year yield of 4.69%, a 10-year yield of 5.00% and a 30-year yield of 5.33%. That made the 10-year minus 2-year spread about +31 basis points and the 10-year minus 3-month spread about +78 basis points. So the US curve is not inverted at the moment. The Federal Reserve held its target range at 3.75% to 4.00% on October 28, with two members voting for a hike, and the 2-year yield stood well above the top of that range. When the 2-year yield sits that far above the policy rate, the market is pricing in a chance of further rate increases.
India. The Reserve Bank of India raised the repo rate by 25 basis points to 5.50% on October 7, 2026, the first hike since February 2023, and moved its stance to calibrated tightening. The 10-year G-sec yield rose to 7.40% on October 30, 2026, which is 0.81 percentage points higher than a year earlier. With the repo rate at 5.50% and the 10-year yield near 7.4%, the Indian curve is clearly upward sloping. Reports around the policy decision linked the climb in yields to inflation concerns, tighter liquidity, higher US yields and rising crude oil prices. September consumer inflation was reported at 5.54%, and the next policy meeting falls in early December.
The main lesson from both curves is that a positively sloped curve does not always mean good news. Here, a steep or steepening curve is partly a message about inflation and policy risk.
How Indian Investors Can Use Yield Curve Analysis
A yield curve is not a trading tip. It is a framework for asking better questions. Here are four practical uses.
1. Choosing debt fund duration. Bond prices fall when yields rise, and longer bonds fall more. If the market expects rates to keep rising, funds with shorter duration, such as short duration or low duration funds, are exposed to less price risk. If the curve points to falling rates ahead, longer-duration gilt funds gain more. You can check a fund’s modified duration in its factsheet to see how much interest-rate risk you are taking.
2. Comparing fixed deposits with bonds. When the curve is steep, long-term G-secs and high-quality corporate bonds can offer a yield well above short-term deposit rates. When the curve is flat, locking money for longer pays little extra, and short deposits or liquid funds can make more sense.
3. Understanding loan rates. Home loans linked to the repo rate respond to RBI moves quickly. Long-term fixed rates follow the longer end of the curve. Watching the slope gives an early idea of where borrowing costs may head.
4. Reading the signal for equities. An inverting US curve has often come before weaker equity returns, and a steep curve helps bank profit margins. Foreign portfolio investors also compare US yields with Indian yields, so a rise in US Treasury yields can add pressure on the rupee and on Indian markets.
This article is general education and not personal investment advice. Your own time horizon, tax position and risk capacity matter more than any single chart.
Common Mistakes When Reading the Yield Curve
- Treating inversion as a countdown. The lead time is a wide range, not a date.
- Using one spread only. Check both the 10-year minus 2-year and the 10-year minus 3-month measures.
- Ignoring the cause of the move. A bull steepener and a bear steepener look alike on a chart but mean opposite things.
- Copying US conclusions for India. The RBI, the fiscal position, oil prices and the rupee shape the Indian curve in their own way.
- Forgetting inflation. A yield means more once you subtract expected inflation. A 7.4% yield with 5.5% inflation gives a smaller real return than the headline suggests.
Frequently Asked Questions About the Yield Curve
What is a yield curve in simple words?
A yield curve is a chart that shows how much interest a government pays on bonds of different lengths, from a few months to 30 years. It tells investors how the market views growth, inflation and interest rates over time.
What does an inverted yield curve mean?
An inverted yield curve means short-term bonds yield more than long-term bonds. It shows that investors expect interest rates to fall in the future, usually because they expect the economy to slow. It has often come before US recessions.
Is the yield curve inverted today?
As of late October 2026, the US 10-year minus 2-year spread is positive, around +31 basis points on October 23, so the main US curve is not inverted. Spreads change daily, so check the US Treasury website for the latest figure.
What is a normal yield curve?
A normal yield curve slopes upward. Short-term bonds pay less than long-term bonds because lenders want extra return for tying up money longer. It usually matches a steady, growing economy with moderate inflation.
How long after inversion does a recession start?
Historically, a recession has followed an inversion by roughly six months to two years, though the gap varies. Some inversions have lasted a long time without a quick downturn, so the curve should not be used as a precise timer.
How does the RBI repo rate affect the yield curve?
The repo rate anchors the short end of the Indian curve. Hikes push short-term yields up, and cuts push them down. Long-term yields depend on expected inflation, government borrowing, oil prices and global yields as well, so the slope can change even when the repo rate stays unchanged.
Which yield curve spread is best for predicting a recession?
Researchers often favour the 10-year minus 3-month spread, while market commentary prefers the 10-year minus 2-year spread. Looking at both gives a fuller picture.
Conclusion
Yield curve analysis comes down to reading a simple chart with care. A normal curve points to steady conditions. A steep curve can mean early recovery or inflation worry. A flat curve marks uncertainty and a change in the rate cycle. An inverted curve warns that the market expects slower growth and lower rates, though the timing is never exact.
For Indian investors, the best habit is to watch the G-sec curve alongside the RBI’s policy stance, inflation and the US Treasury curve. Use that picture to decide how much interest-rate risk you hold in debt funds, how long to lock in deposits, and how to plan around loan rates. The curve will not tell you what happens next, but it will show you what the market is already pricing in.
Disclaimer: This article is for educational purposes and is not investment advice. Bond yields and policy rates change often, so verify current figures with official sources such as the RBI, the US Treasury and the Federal Reserve before making any decision.