
Modern Portfolio Theory in Practice: Why the Efficient Frontier Matters to Indian Investors
Most Indian investors build a portfolio by accident. A fixed deposit because the family always did it. Two mutual funds because a colleague liked them. Some gold from a wedding. Maybe a plot of land or a flat that took most of the savings. Each piece made sense on the day it was bought, but nobody ever asked how the pieces behave together.
That question is the whole point of Modern Portfolio Theory, or MPT. Harry Markowitz published the idea in 1952 and won a Nobel Prize for it in 1990. His main message is simple. Do not judge an investment alone. Judge it by what it does to the rest of your money.
Here is what MPT says, what the efficient frontier is, how it fits Indian asset classes like the Nifty 50, gold and PPF, and where the theory falls short.
What Is Modern Portfolio Theory?
Modern Portfolio Theory is a method for building an investment portfolio that aims for the highest possible return for a given level of risk. It treats risk as the ups and downs in returns, measured by standard deviation, and it says that mixing assets that do not move in step can lower the overall risk without giving up much return.
Think of a shop that sells both umbrellas and cold drinks. Umbrellas sell in a rainy week and cold drinks in a hot one, so the shop earns steady income even though each product is unpredictable. A good portfolio works the same way.
Owning 20 stocks from the same sector is not diversification. Owning equity, debt and gold, which react differently to the same news, is.
The Three Numbers Behind MPT
MPT rests on three inputs. You do not need a finance degree to follow them.
Expected return. This is the average yearly gain you can reasonably hope for from an asset over a long period. For equity it is higher, for a PPF account it is lower and fixed.
Risk, or standard deviation. This tells you how far returns swing around that average. A fixed deposit barely swings. A small cap fund can swing 30 or 40 per cent in a bad year. Higher standard deviation means a bumpier ride.
Correlation. This is the most useful number and the one most people skip. Correlation runs from minus 1 to plus 1. If two assets have a correlation of 1, they move together and mixing them helps nothing. If it is close to zero, they move independently. If it is negative, one tends to rise when the other falls. The lower the correlation, the more diversification you get.
What Is the Efficient Frontier?
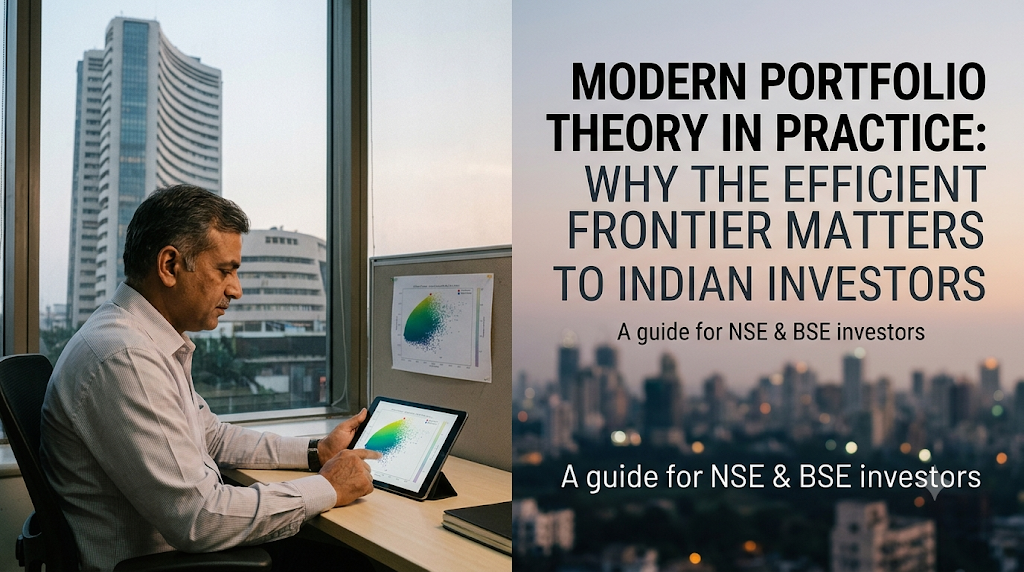
Suppose you could build thousands of portfolios from the same set of assets, changing the weights each time. Plot each one on a graph with risk on the horizontal axis and expected return on the vertical axis. The dots form a cloud shaped a bit like a bullet or an umbrella lying on its side.
The upper edge of that cloud is the efficient frontier. Every portfolio on that curved line gives the best return available for its level of risk. Every portfolio below the line is inefficient, because you could get either more return for the same risk or the same return for less risk by changing the mix.
Three points follow from this picture.
First, there is no single best portfolio. There is a curve of efficient ones, and you pick the spot that matches how much volatility you can handle without panic selling.
Second, a portfolio sitting below the curve is leaving money on the table. Many Indian household portfolios, heavy in one asset like real estate or bank deposits, sit well below it.
Third, a 28-year-old software engineer and a 62-year-old retiree should sit at different points on the curve, even with the same building blocks.
A Worked Example With Indian Asset Classes
Let us make this real with a small example. The numbers below are assumptions for illustration only. They are not forecasts, and you should replace them with your own estimates.
Assume three building blocks:
| Asset | Assumed yearly return | Assumed risk (standard deviation) |
|---|---|---|
| Nifty 50 index fund (equity) | 12% | 18% |
| PPF or high quality debt | 7% | 2% |
| Gold ETF | 9% | 15% |
Assume equity and debt have a correlation of 0.1, and that gold has a correlation of about zero with both. Now compare three portfolios.
| Portfolio | Mix (equity / debt / gold) | Expected return | Risk | Sharpe ratio* |
|---|---|---|---|---|
| A | 100 / 0 / 0 | 12.0% | 18.0% | 0.31 |
| B | 70 / 30 / 0 | 10.5% | 12.7% | 0.32 |
| C | 60 / 25 / 15 | 10.3% | 11.1% | 0.34 |
*Using an assumed risk-free rate of 6.5%.
Look at Portfolio B against Portfolio C. Adding a 15 per cent slice of gold costs about 0.2 percentage points of expected return, but it cuts risk by roughly 1.6 points. Portfolio C gets more return per unit of risk. That is the efficient frontier at work. You did not find a magic asset. You found a better mix.
Portfolio A has the highest return on paper, but with an 18 per cent swing a year. Whether that suits you depends on your age, income stability and nerves.
What Indian Data Says About Risk and Return
Real numbers are messier than tidy examples. Treat these as rough guides, since they change with the start date and the source.
Over the last ten years, the Nifty 50 Total Return Index has grown at around 12 per cent a year, according to fund house factsheet data. Over 20 years, most datasets put it at 11 to 12 per cent.
Gold in rupee terms has done very well lately. One 20-year dataset shows about 15 per cent a year, with a three-year run above 35 per cent, helped by central bank buying and a weaker rupee. Other datasets show lower figures. Gold was also flat to negative for stretches between 2013 and 2018, which is why nobody should chase its recent run.
PPF pays 7.1 per cent, and the government has left the rate unchanged for many quarters in a row. The Finance Ministry is due to review small savings rates around 30 September 2026 for the October to December quarter, so check the latest notification before you plan around it.
What matters is that equity, gold and government-backed debt have taken turns leading and lagging. A portfolio holding all three does not depend on your guessing the winner.
The Sharpe Ratio: Measuring Risk-Adjusted Returns
Once you start comparing mixes, you need a yardstick. The most common one is the Sharpe ratio. It takes the return above a risk-free rate and divides it by the standard deviation.
In plain words, it tells you how much extra return you earned for each unit of risk you took. A higher Sharpe ratio is better. A fund that returned 14 per cent with wild swings can have a lower Sharpe ratio than a fund that returned 11 per cent smoothly.
On the efficient frontier, one portfolio has the highest Sharpe ratio. That is the best risk-adjusted mix of the risky assets you chose. You can then blend it with a safe asset like PPF or a liquid fund to dial risk up or down.
Indian mutual fund factsheets already show the Sharpe ratio and standard deviation, so check them when you compare two funds in the same category.
How to Apply MPT Without a Spreadsheet Degree
You do not need software to use the ideas. Here is a practical way to go about it.
Step 1: List everything you own. Include EPF, PPF, NPS, fixed deposits, mutual funds, direct stocks, gold, and property. Many people forget EPF and NPS, which are big debt and equity holdings in disguise.
Step 2: Sort it into a few buckets. Equity, debt, gold, and real estate are enough to begin with. If you hold international funds or REITs, add them as separate buckets.
Step 3: Check the overlap. Three large cap funds and a Nifty 50 index fund hold mostly the same 50 companies. That is one bet, not four. Check the top holdings of each fund before adding another, and be wary of chasing whatever asset won last year.
Step 4: Pick a target mix. A common starting point for a young investor with a long horizon is 60 to 75 per cent equity, 15 to 30 per cent debt, and 5 to 15 per cent gold. Someone close to retirement will hold much more debt. These are starting points and not rules, so adjust them for your own situation.
Step 5: Use low cost building blocks. A Nifty 50 or Nifty 500 index fund for equity, PPF, EPF or a short duration debt fund for debt, and a gold ETF for gold keeps costs low. Costs come straight off your return every year, whatever the market does.
Step 6: Write the plan down. A written target mix keeps you from deciding in the middle of a crash or a rally.
Rebalancing: Keeping the Portfolio on the Frontier
Markets move, so your mix drifts. If equity has a great year, a 60 per cent equity portfolio can become 68 per cent without you doing anything. Your risk has gone up quietly.
Rebalancing brings the mix back to target. There are two simple ways to do it. One is to check once a year and reset. The other is to act only when an asset drifts more than 5 percentage points from its target.
Tax is the catch in India, so plan around it. For equity mutual funds and listed shares held over 12 months, long term gains above ₹1.25 lakh in a financial year are taxed at 12.5 per cent. Gains from units held 12 months or less are taxed at 20 per cent. Debt mutual funds bought after 1 April 2023 are taxed at your income tax slab rate, whatever the holding period. Gold funds have their own rules and holding periods, and they do not get the ₹1.25 lakh exemption, so check the rules for the specific product you hold.
Because selling can trigger tax, the cheapest way to rebalance is often to send fresh money to the underweight asset. If you invest through a SIP, simply direct new SIP money to whichever bucket has fallen behind. You may never need to sell anything.
Tax rules change, and the new Income Tax Act 2025 has been in force since 1 April 2026, so confirm the current position before you sell.
Where Modern Portfolio Theory Falls Short
MPT is a useful frame, not a crystal ball. Here are its main weaknesses, and you should know them before you rely on it.
Inputs are guesses. The math needs expected returns, risks and correlations. Nobody knows these in advance. Past data is only a rough guide, and small changes in the inputs can change the answer a lot.
Correlations rise in a crisis. When markets crashed in March 2020, with the Nifty falling close to 40 per cent in about two months, many assets that normally move apart fell together for a while. Diversification helps less exactly when you want it most, although it still helps over full cycles.
Returns are not neatly bell shaped. Real markets have fat tails, meaning extreme moves happen more often than the theory expects. Standard deviation also treats gains and losses alike, while most investors only mind the losses. Maximum drawdown says more about how a bad year will feel.
It ignores your life. MPT does not know about your home loan, your job security, your parents’ medical bills or your child’s college fees. Your own goals and timelines matter more than any curve.
Use the theory for direction and not for precision.
Final Thoughts
The efficient frontier is a simple idea that changes how you look at your money. Stop asking which single investment is best. Start asking which mix gives you the return you need for the risk you can stand.
For most Indian investors, that means a plain plan: a broad equity index fund, a solid debt base such as PPF or EPF, a modest slice of gold, a written target mix, and a yearly check to rebalance. It is not exciting, but it follows the idea Markowitz set out more than 70 years ago, and it lets you stop guessing which asset will win next year.
This article is for education and is not personalised investment advice. Consider speaking with a SEBI registered investment adviser before making changes to your portfolio.
Frequently Asked Questions
What is the efficient frontier in simple words?
The efficient frontier is a curve that shows the best possible portfolios for each level of risk. Any portfolio on the curve gives the highest expected return for its risk. Any portfolio below the curve can be improved by changing the mix of assets.
Does Modern Portfolio Theory work for Indian investors?
Yes, the core ideas apply in India as they do anywhere. Equity, debt and gold often behave differently from each other, so combining them can lower risk. The theory depends on estimates, and correlations rise in market crashes, so treat it as a guide and not a guarantee.
How many mutual funds should I hold for a diversified portfolio?
Most investors do well with three to five funds, as long as they cover different asset classes and do not overlap heavily. A broad equity index fund, a debt fund or PPF, and a gold ETF can already give a sound base. Adding more funds from the same category usually adds cost and paperwork without adding diversification.
What is a good Sharpe ratio for a mutual fund?
A Sharpe ratio above 1 is generally seen as good, and above 2 as very good, though the figure depends on the time period and the category. Compare Sharpe ratios only between funds of the same type, such as two large cap funds, because different categories carry different risks.
How often should I rebalance my portfolio?
Once a year is enough for most people. Some investors also rebalance when any asset moves more than 5 percentage points away from its target. Using new SIP money to top up the underweight asset is often the cheapest way, since it avoids selling and paying tax.
Should gold be part of an efficient portfolio?
Gold has often moved differently from Indian equity, which makes it a useful diversifier. A small allocation, commonly 5 to 15 per cent, can lower overall risk. Gold does not produce income, and its returns can go flat for years, so it works best as a supporting part of the portfolio and not the main holding.
Is PPF part of Modern Portfolio Theory?
PPF works as the low risk, government backed part of an Indian portfolio. It pays a fixed rate, currently 7.1 per cent, which is reviewed every quarter. In MPT terms, it plays the role of the near risk-free asset that anchors the safer side of your mix.