
Portfolio Turnover: The Hidden Cost of Active Investment Strategies
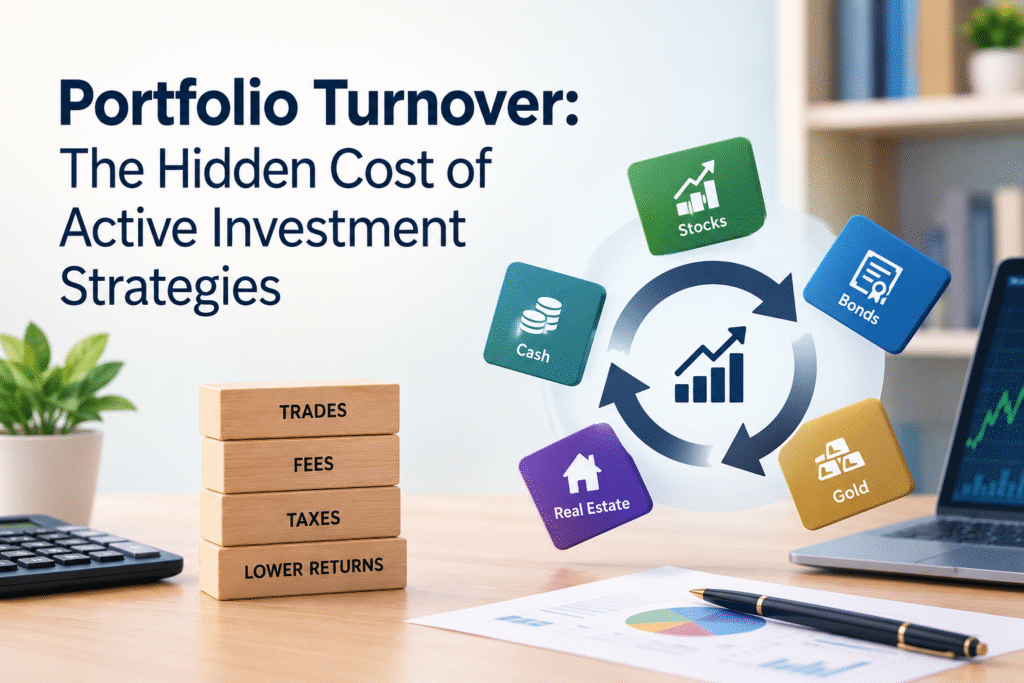
Most investors check two numbers before they pick a fund or a strategy: last year’s return and the expense ratio. Very few look at a third number, which is how often the portfolio is traded. That number is called portfolio turnover, and it quietly decides how much of your return you actually keep.
Quick answer: Portfolio turnover is the percentage of a portfolio that is bought and sold during a year. A turnover of 100% means the holdings were replaced once over the year. Higher turnover usually means higher brokerage, higher taxes and more market impact cost, and these costs reduce your net return even when the headline return looks good.
In this guide you will learn what the portfolio turnover ratio means, how to calculate it, why it works as a hidden cost, what the data says about active investing in India, and what a sensible turnover level looks like for a long-term investor.
What Is Portfolio Turnover?
Portfolio turnover measures how much trading happens inside a portfolio. A fund manager who buys a stock and holds it for five years adds very little to turnover. A manager who sells half the portfolio every six months adds a lot.
The same idea applies to you as a direct stock investor. If you rotate out of last quarter’s laggards into this quarter’s favourites, your personal portfolio turnover is high, whether or not you ever calculated it.
Turnover is a measure of activity, not of skill. A high number does not prove that a manager is good or bad. It only tells you how much the portfolio is being traded, and trading has a price.
How to Calculate the Portfolio Turnover Ratio
The usual portfolio turnover formula takes the lower of total purchases or total sales during the year, then divides it by the average value of the portfolio over the same period.
Portfolio Turnover Ratio = (Lower of Purchases or Sales ÷ Average Portfolio Value) × 100
Here is a simple example. Suppose your portfolio averages ₹10 lakh over the year. During that year you buy shares worth ₹6 lakh and sell shares worth ₹7 lakh. The lower figure is ₹6 lakh, so your turnover is ₹6 lakh divided by ₹10 lakh, which is 60%.
Using the lower of the two figures keeps the ratio from being inflated by new money coming in or money being withdrawn. It measures real churn in the holdings rather than the effect of deposits and redemptions.
Fund houses use slightly different methods, especially for funds that trade derivatives, so compare turnover only between funds in the same category.
Why Portfolio Turnover Is a Hidden Cost
Every trade has a cost, and most of these costs never appear as a line on your statement. Here are the five that matter most.
1. Brokerage and transaction charges. Each purchase and sale pays brokerage and exchange charges. For a mutual fund, these costs are taken out of the scheme’s assets, so you see them only as a slightly lower NAV. Before April 2026, brokerage and transaction costs incurred by funds were not counted inside the TER. Under SEBI’s newer framework, the daily TER is now shown as four parts: the base expense ratio, brokerage, transaction cost and statutory levies. That is one reason some funds now show a higher TER than before, even though the actual cost of investing may not have gone up, because the disclosure is simply more complete. SEBI has also lowered the cap on cash market brokerage to around 6 basis points, from 8.5 basis points earlier.
2. Statutory levies. If you trade shares directly, Securities Transaction Tax is charged on delivery trades at roughly 0.1% on each side. Stamp duty, GST on brokerage and depository charges on every sale add to this. Each charge looks small. Repeated across many trades, they add up.
3. Impact cost and the bid-ask spread. When a fund buys or sells a large quantity of a mid-cap or small-cap stock, its own order moves the price against it. You never see this on a bill. It shows up as a purchase price a little higher, or a sale price a little lower, than the quote you saw on screen.
4. Tax drag. This is usually the largest cost for a direct investor, and it is covered in the next section.
5. The cost of being wrong twice. An active switch needs two correct decisions, one to sell the old holding at a good time and one to buy the new holding at a good time. Most investors do not get both right often enough to pay for the costs above.
Tax Drag: How Turnover Raises Your Capital Gains Tax
For direct equity investors, turnover has a direct effect on the tax bill. For FY 2026-27, equity gains held for more than 12 months are taxed at 12.5% on gains above ₹1.25 lakh in a year, while short-term gains attract a flat 20%. These rates were not changed in Budget 2026.
Here is what that difference means in rupees. Assume you make a gain of ₹2 lakh on a share, and you pay 4% health and education cess on the tax.
| Holding period | Taxable gain | Tax rate | Tax payable (with 4% cess) |
|---|---|---|---|
| Sold within 12 months | ₹2,00,000 | 20% | ₹41,600 |
| Sold after 12 months | ₹75,000 (after the ₹1.25 lakh exemption) | 12.5% | ₹9,750 |
The same gain costs ₹31,850 more in tax when the share is sold a few weeks too early. An investor who turns over the portfolio every few months will pay the higher rate on most of the profit, and will rarely use the ₹1.25 lakh yearly exemption.
Intraday trading is treated differently. Profit from intraday equity trades is taxed as speculative business income, not as capital gains. Futures and options traders also face higher costs now, because Budget 2026 raised the STT on futures from 0.02% to 0.05% and on options to 0.15%.
Mutual fund investors get some relief here. Because most equity mutual funds do not pass the tax on internal portfolio churn directly to investors, a fund can sell a stock at a profit without sending you a tax bill. You pay capital gains tax only when you redeem your units. This is a real advantage of funds over direct stock trading for people who like some activity in their portfolio. The brokerage and impact costs still remain, though.
How Turnover Compounds Into a Large Gap
A cost of 1% or 2% a year feels too small to worry about. Over twenty years it is not small at all.
Take two investors who each start with ₹10 lakh and earn the same 12% a year before costs. Investor A runs a low-turnover portfolio and loses about 0.5% a year to costs and taxes. Investor B runs a high-turnover portfolio and loses about 2.5% a year.
| Investor | Net return per year | Value after 20 years |
|---|---|---|
| A (low turnover) | 11.5% | about ₹88 lakh |
| B (high turnover) | 9.5% | about ₹61 lakh |
The two investors had the same stock-picking ability in this example. The only difference was the cost of trading, and it came to roughly ₹27 lakh. This is an illustration with assumed numbers, not a forecast, but the pattern is real. Costs are certain, while returns are not.
What the Data Says About Active Investing in India
The costs above would be easy to accept if active strategies reliably beat the market. The evidence is mixed at best.
The SPIVA India Scorecard from S&P Dow Jones Indices compares active funds with their benchmarks. For the ten years to June 2026, more than 70% of active funds underperformed in every category it examined. The picture is not one-sided. In 2025, a majority of active mid-cap and small-cap funds beat their benchmark, which was their best relative result since 2014. Some analysts also argue that the benchmark change made in mid-2024 affects how fairly large-cap funds are judged. So the sensible reading is that beating the index is hard and uncommon over long periods, but not impossible.
The numbers are harsher for individual traders. SEBI’s FY26 study found that 87.7% of individual equity derivatives traders made a net loss, and that transaction costs pushed the share of losing traders up from 82.1% to 87.7%. In rupee terms, individual traders lost ₹91,685 crore in FY26, and options accounted for 92% of those losses. Derivatives trading is an extreme case of high turnover, but it shows how costs can turn a roughly even contest into a lopsided one.
International research points the same way. The well-known work of Brad Barber and Terrance Odean on retail brokerage accounts in the United States found that the households that traded most earned noticeably less than the households that traded least.
Active vs Passive Investing: Where Turnover Fits
Index funds and ETFs have low portfolio turnover by design. They change holdings only when the index changes, so brokerage, impact cost and tax events stay small. This is a large part of why their expense ratios are low and why active vs passive investing comes down to cost so often.
Active funds have a different job. They try to beat the market, and that needs trading. The question to ask is whether the extra return is likely to pay for the extra cost. A fund with a turnover of 150% needs to earn a meaningful amount more, before costs, than a fund with a turnover of 30% just to finish level with it.
When High Portfolio Turnover Is Acceptable
High turnover is not always a problem. Some funds are built to trade often, and judging them by the same yardstick as a long-term equity fund would be unfair.
- Arbitrage funds trade constantly by design to capture price gaps between cash and futures markets.
- Balanced advantage and equity savings funds shift between equity and debt as valuations change, which raises their turnover.
- Momentum and quantitative strategies rebalance on a schedule, and the trading is part of how they earn their return.
- Debt funds often show high turnover because bonds mature and are replaced, so the ratio says little about quality there.
For an actively managed long-term equity fund, though, a persistently high turnover with no matching record of returns above its category is a warning sign.
What Is a Good Portfolio Turnover Ratio?
There is no official figure. As a rough rule of thumb, many investors treat a turnover below 50% as low, 50% to 100% as moderate, and above 100% as high for a diversified equity fund. Treat these as guide numbers and not as regulations.
A more useful test is comparison. Look at the turnover ratio of the fund against other funds in the same category, and against its own figure from earlier years. A flexi-cap fund that turns over 20% of its holdings a year is telling you something different from one that turns over 180%.
How to Check a Fund’s Portfolio Turnover Ratio
SEBI requires funds to disclose turnover. All funds must report it along with their monthly and half-yearly portfolio disclosures. You can usually find it in these places:
- The monthly factsheet of the scheme, on the fund house website.
- The scheme information document and the annual report.
- Fund research pages on major mutual fund platforms, which show it next to the expense ratio.
How to Keep Your Own Portfolio Turnover Low
You can control turnover in a direct portfolio, and a few habits make the biggest difference.
- Write down why you bought each holding. If the reason still holds, there is nothing to sell.
- Set a minimum holding period. Holding past 12 months in most cases moves your gain into the lower tax rate.
- Rebalance on a schedule or on a threshold. Reviewing once or twice a year, or when an asset class drifts by a set margin, is far cheaper than reacting to every market move.
- Use new money to rebalance first. Directing fresh investments to the underweight asset avoids a sale and the tax that goes with it.
- Keep a passive core. Many investors hold an index fund as the main part of the portfolio and add a smaller active portion, so most of the money stays in a low-turnover holding.
- Check cost before you switch. Add up tax, exit load, brokerage and the gap between the buy and sell prices, and then ask whether the expected gain is larger than that total.
Frequently Asked Questions
What is portfolio turnover ratio in simple words?
It is the percentage of a portfolio’s holdings that were bought and sold during a year. A ratio of 50% means that about half the portfolio was replaced over the year.
What is a good portfolio turnover ratio for a mutual fund?
For a long-term equity fund, a ratio below 50% is generally seen as low and above 100% as high. The fair way to judge it is against other funds in the same category.
Is high portfolio turnover always bad?
No. Arbitrage funds, balanced advantage funds and quantitative strategies trade often by design. For a traditional long-term equity fund, high turnover raises costs and needs to be justified by returns above the category.
How do you calculate portfolio turnover ratio?
Divide the lower of total purchases or total sales in a year by the average portfolio value, then multiply by 100. For example, ₹6 lakh of purchases on an average portfolio of ₹10 lakh gives a ratio of 60%.
Does portfolio turnover affect my tax if I hold mutual funds?
In most cases it does not create a tax bill for you directly. Equity funds do not pass the tax on internal trading to unit holders, and you pay capital gains tax only when you redeem. High turnover still reduces your return through brokerage and transaction costs.
Where can I find a mutual fund’s portfolio turnover ratio?
It is published in the monthly factsheet, the scheme information document and the annual report of the fund, and most fund research platforms display it too.
Do index funds have a portfolio turnover ratio?
Yes, and it is usually low, because index funds trade mainly when the index changes its constituents.
The Bottom Line
Portfolio turnover is easy to ignore, because its costs never arrive as a bill. They arrive as a slightly smaller portfolio value, year after year. Before you choose a fund or change your own holdings, check the turnover ratio, add up what the trading will cost you in tax and charges, and ask whether the expected gain is larger than that cost. In many cases, the best trade is the one you do not make.
Disclaimer: This article is for education and general information only. It is not investment, tax or legal advice. Mutual fund investments are subject to market risks. Tax rules can change, so please consult a SEBI-registered investment adviser or a qualified tax professional before you act.