
Working Capital Analysis: What Receivables and Inventory Reveal About a Business
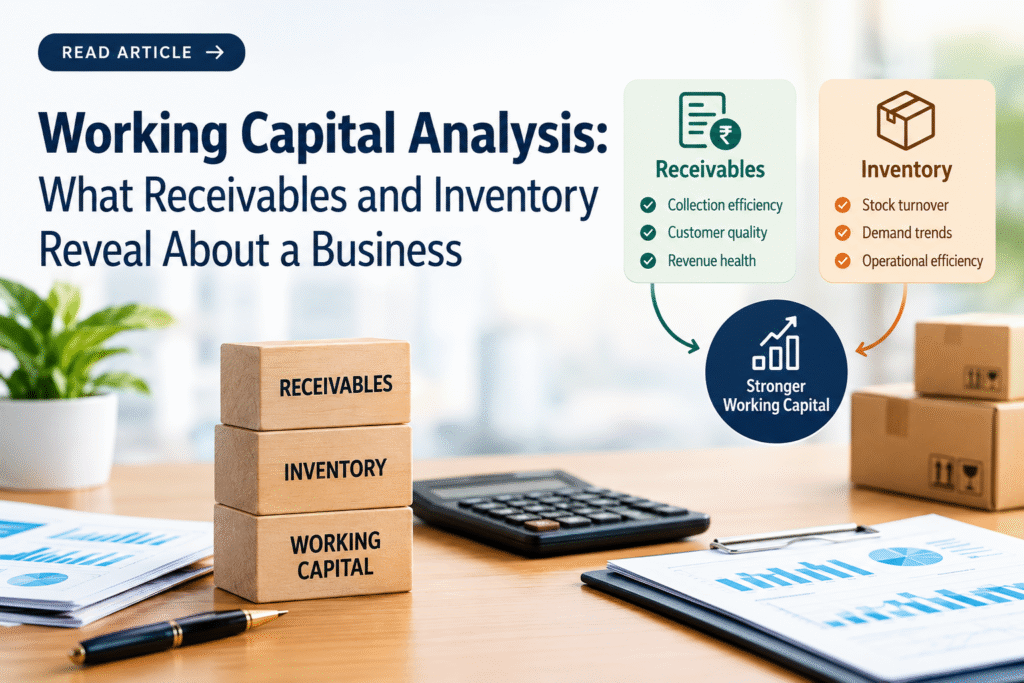
A company can report rising sales, a healthy profit and a growing order book, and still run short of cash. Most retail investors learn this the hard way. The profit shows up in the income statement, but the cash is sitting in unpaid customer invoices and unsold stock on the shelf.
This is the reason working capital analysis matters. It tells you whether a business converts its sales into cash quickly, or whether the money gets stuck along the way. Two items do most of the talking: receivables and inventory.
This guide explains what working capital analysis is, how to calculate debtor days, inventory days and the cash conversion cycle, and what these numbers reveal about a business before you put your money in its shares.
What Is Working Capital Analysis?
Working capital analysis is the study of how a company manages its short-term assets and short-term liabilities. These are the items that move through the business every few weeks or months, such as cash, trade receivables, inventory and trade payables.
The purpose is simple. A company must pay salaries, suppliers, rent and electricity bills long before some of its customers pay it back. Working capital is the money that bridges that gap. If the gap is small, the business runs smoothly. If the gap is large, the company needs to borrow, and borrowing eats into profit.
Working Capital Formula and Net Working Capital
The basic working capital formula is:
Net Working Capital = Current Assets minus Current Liabilities
Current assets include cash, bank balances, trade receivables, inventory and short-term investments. Current liabilities include trade payables, short-term borrowings, advances from customers and provisions that fall due within a year.
A positive net working capital means the company has more short-term assets than short-term obligations. A negative figure means the opposite. Many readers assume negative working capital is always bad, but that is not true. Businesses that collect cash from customers on the spot and pay suppliers later, such as some retailers and food delivery companies, often run with negative working capital by design.
The point to remember is that the total figure alone says very little. The real information sits inside it, in the quality and speed of receivables and inventory.
Why Profit Alone Does Not Tell the Full Story
Profit is an accounting number. Cash is the money you can actually spend. A company books revenue when it delivers goods or services, not when the customer pays. So a firm can show a handsome profit while its bank balance keeps shrinking.
A study of the 500 largest Indian companies by EY, covering FY17, found that the cash conversion cycle rose to 44 days, mainly because inventory levels went up. The same report noted that Indian companies tend to have a longer cash conversion cycle than companies in developed economies, which means more cash stays trapped in the business. The study is a few years old, but the pattern it describes has not gone away.
This is why careful investors read the balance sheet along with the profit and loss account.
What Receivables Reveal About a Business
Trade receivables, also called sundry debtors or accounts receivable, are the amounts customers owe the company for goods or services already delivered. They show up as a current asset, but they are not cash until the customer pays.
Receivables are one of the best tests of business quality. A company with a strong product and real pricing power can usually collect on time. A company that has to offer long credit periods to win orders is telling you something about its position in the market.
Receivables Turnover Ratio and Debtor Days
Two simple calculations help here.
Receivables Turnover Ratio = Net Credit Sales divided by Average Trade Receivables
Debtor Days (Days Sales Outstanding) = Average Trade Receivables divided by Net Sales, multiplied by 365
A higher receivables turnover ratio means the company collects money faster. Lower debtor days mean the same thing. If a company shows debtor days of 40, it takes about 40 days on average to collect from customers. If that figure climbs to 90 over three years, the company is waiting a lot longer for its money.
Some analysts use 360 days instead of 365. Either is fine, as long as you stay consistent when comparing companies.
Warning Signs in Receivables
Watch for these patterns when you study a company’s trade receivables:
- Receivables growing faster than sales for two or three years in a row
- Debtor days rising while competitors hold steady
- A large share of receivables outstanding for more than six months
- Rising provisions for doubtful debts, or sudden write-offs of bad debts
- A big jump in receivables in the last quarter of the year, which can point to aggressive selling on credit to meet targets
- Heavy dependence on one customer or on government departments known for slow payment
When sales go up by 20 percent and receivables go up by 60 percent, the extra sales may not be as real as they look. Some companies push stock onto distributors at the end of a quarter to lift reported revenue. This is sometimes called channel stuffing, and receivables are usually where it leaves a footprint.
What Inventory Reveals About a Business
Inventory is the stock a company holds. For a manufacturer it includes raw materials, work in progress and finished goods. For a retailer it is the goods waiting to be sold.
Inventory is a cost sitting on the balance sheet. It needs storage space, insurance and financing, and it can lose value if it becomes outdated or damaged. Too little inventory causes lost sales. Too much locks up cash.
Inventory Turnover Ratio and Inventory Days
Inventory Turnover Ratio = Cost of Goods Sold divided by Average Inventory
Inventory Days (Days Inventory Outstanding) = Average Inventory divided by Cost of Goods Sold, multiplied by 365
A higher inventory turnover ratio means stock moves quickly. Lower inventory days mean the company turns its stock into sales faster. As with debtor days, the figure only makes sense when compared with similar businesses. A jewellery maker will always hold stock longer than a vegetable wholesaler.
Warning Signs in Inventory
- Inventory days rising year after year without a clear reason such as a new plant or a seasonal build-up
- Inventory growing faster than sales
- Finished goods piling up while raw material purchases continue
- Frequent inventory write-downs or provisions for obsolete stock
- Changes in the way inventory is valued, for example a switch between FIFO and weighted average cost
- Notes in the annual report that mention slow-moving or non-moving items
Rising inventory can also be a good sign in some cases. A company that stocks up ahead of a festival season or a planned price rise may show higher inventory for a good reason. This is why you should read the management commentary along with the numbers.
Trade Payables: The Third Piece of the Puzzle
Receivables and inventory use up cash. Trade payables, the amounts a company owes its suppliers, bring cash in, because the company is using its suppliers’ money for a while.
Payable Days (Days Payable Outstanding) = Average Trade Payables divided by Cost of Goods Sold (or Purchases), multiplied by 365
Longer payable days help the company’s cash position, but only up to a point. A business that stretches payments too far may damage supplier relationships or face penalties. In India, there is also a specific rule that limits how long a company can delay payment to small suppliers, which we cover below.
The Cash Conversion Cycle: Putting It All Together
The cash conversion cycle (CCC) joins the three measures into one number. It shows how many days a company’s cash stays locked up between paying for raw materials and collecting money from customers.
Cash Conversion Cycle = Inventory Days + Debtor Days minus Payable Days
A shorter cycle is generally better, because cash comes back sooner. A longer cycle means the company needs more funding to keep running, usually in the form of short-term bank borrowing. The sum of inventory days and debtor days is called the operating cycle.
Some strong businesses have a negative cash conversion cycle. They collect from customers quickly, sell their stock fast and pay suppliers later. Studies of Indian companies have noted this pattern in firms with very short collection and inventory periods and long payment periods to creditors.
A Simple Worked Example
Take two imaginary companies, A and B. Both report sales of ₹1,000 crore, cost of goods sold of ₹700 crore and a net profit of ₹100 crore. On the income statement they look identical. The balance sheet tells a different story.
| Item | Company A | Company B |
|---|---|---|
| Trade receivables | ₹100 crore | ₹300 crore |
| Inventory | ₹120 crore | ₹250 crore |
| Trade payables | ₹115 crore | ₹100 crore |
| Debtor days | about 37 | about 110 |
| Inventory days | about 63 | about 130 |
| Payable days | about 60 | about 52 |
| Cash conversion cycle | about 39 days | about 188 days |
Company A takes about 39 days to turn its spending back into cash. Company B takes about 188 days. Compared with Company A, Company B has roughly ₹345 crore more cash tied up in receivables, inventory and supplier payments. To fund that gap, it must borrow, and the interest cost will cut into its profit in the years ahead.
An investor looking only at the profit figure would call these two companies equals. An investor who studies working capital would pay a higher price for Company A.
Section 43B(h): An Indian Rule That Affects Payables
Indian investors should know about one more factor. Section 43B(h) of the Income Tax Act came into effect on 1 April 2024. Under this rule, if a buyer owes money to a registered micro or small enterprise and does not pay within the time limit, the buyer cannot claim the tax deduction for that expense until the payment is actually made.
The time limit is 45 days from the date of acceptance of goods or services when a written agreement exists. Without a written agreement, the limit is 15 days.
This matters for analysis in two ways. First, companies that depended on long credit from small suppliers may now see their payable days shrink, which can raise their working capital needs. Second, small manufacturers who sell to large buyers may see their debtor days improve. When you study a company in a sector with many small suppliers, such as textiles, auto components or packaging, check whether payable days have changed since FY25.
Why Industry Matters
No single number works as a good or bad mark for every company. A rough rule of 30 to 60 days is sometimes quoted for the cash conversion cycle of small businesses, but that is only a guide.
- Capital goods and defence companies often have long cycles, because projects take months to deliver and payment follows milestones.
- FMCG companies usually run short cycles, because their products sell quickly and distributors pay fast.
- Pharma and engineering firms vary widely based on export share and product mix.
- Retailers and consumer internet companies may show low or negative working capital.
The right way to judge is to compare a company against its own history and against its closest peers. A company whose cycle is stretching while peers hold steady is the one that deserves a closer look.
How to Do Working Capital Analysis in Five Steps
- Collect five to ten years of data. Pull sales, cost of goods sold, receivables, inventory and payables from the annual reports or a free screening site such as Screener.
- Calculate debtor days, inventory days and payable days for each year. Look at the direction of travel, not just the latest figure.
- Work out the cash conversion cycle. Plot it over time and note any sudden jumps.
- Compare with peers. Use two or three competitors of similar size in the same line of business.
- Check operating cash flow against net profit. If profit keeps rising while cash flow from operations stays flat or falls, working capital is probably absorbing the cash. Then read the notes to accounts and the auditor’s remarks for an explanation.
Common Mistakes Investors Make
- Looking at one year only. A single year can be distorted by a big order or a festival season.
- Using year-end balances without checking averages, which can hide seasonal swings.
- Comparing companies from different industries.
- Ignoring short-term borrowings, which often rise when working capital is under stress.
- Treating higher inventory as a positive sign of future sales without checking the reason.
- Skipping the notes to the accounts, where ageing of receivables and inventory valuation methods are disclosed.
Frequently Asked Questions
What is working capital analysis in simple words?
Working capital analysis checks whether a company has enough short-term resources to pay its short-term bills and how quickly it turns sales into cash. It looks at net working capital, receivables, inventory, payables and the cash conversion cycle.
What is the formula for net working capital?
Net working capital equals current assets minus current liabilities. Current assets include cash, receivables and inventory. Current liabilities include trade payables and short-term borrowings.
What do high debtor days mean?
High debtor days mean a company takes a long time to collect money from customers. It can point to weak pricing power, lenient credit terms, disputes with customers or a risk of bad debts. It should be compared with the company’s own past figures and with peers.
What is a good inventory turnover ratio?
There is no single good figure, because it depends on the industry. A higher ratio generally means stock sells faster. A grocery chain may turn its stock many times a year, while a heavy machinery maker may turn it only a few times. Compare a company with similar businesses.
What is the cash conversion cycle formula?
Cash conversion cycle equals inventory days plus debtor days minus payable days. It shows the number of days a company’s cash stays tied up in operations before it comes back as payment from customers.
Can a company have negative working capital and still be healthy?
Yes. Businesses that get paid by customers upfront and pay suppliers later can run with negative working capital without any trouble. The concern arises when negative working capital comes from rising short-term debt and unpaid bills rather than from strong business terms.
Is a short cash conversion cycle always better?
Generally yes, because cash returns sooner. But a company that cuts inventory too low may lose sales, and one that squeezes customers too hard may lose them. The best cycle balances speed with steady sales.
How does Section 43B(h) affect working capital?
Section 43B(h) denies a tax deduction to buyers who pay registered micro and small suppliers late, beyond 45 days with a written agreement or 15 days without one. This pushes large buyers to pay faster, which can raise their working capital needs and ease the cash position of small suppliers.
Final Thoughts
Profit tells you what a company earned on paper. Receivables and inventory tell you whether that profit turned into money. When debtor days and inventory days stay steady or fall, the business is usually collecting well and selling well. When they climb year after year, trouble is often building quietly in the balance sheet, well before it shows up in the share price.
Before you buy any stock, spend ten minutes on its working capital. Calculate the three day-counts, work out the cash conversion cycle, and compare it with peers and with the company’s own history. It is one of the simplest and most dependable checks in fundamental analysis.
This article is for educational purposes only and is not investment advice. Please consult a SEBI-registered investment adviser before making investment decisions.