
Default Risk, Recovery Rate and Expected Loss: Understanding Credit Analysis
When you buy a corporate bond, an NCD or a debt mutual fund, you are lending money. The interest rate on the offer page is what you hope to earn. Credit analysis asks a different question: how much could you lose if the borrower does not pay?
Three ideas answer that question. They are default risk, recovery rate and expected loss. This guide explains each one in plain language, shows the formula with a worked rupee example, and uses recent Indian data so you can see how the numbers look in practice.
Quick Answer: What Are Default Risk, Recovery Rate and Expected Loss?
- Default risk is the chance that a borrower fails to pay interest or principal on time. Analysts call this the probability of default (PD).
- Recovery rate is the share of the money owed that lenders get back after a default.
- Loss given default (LGD) is the part lenders do not get back. LGD = 1 minus recovery rate.
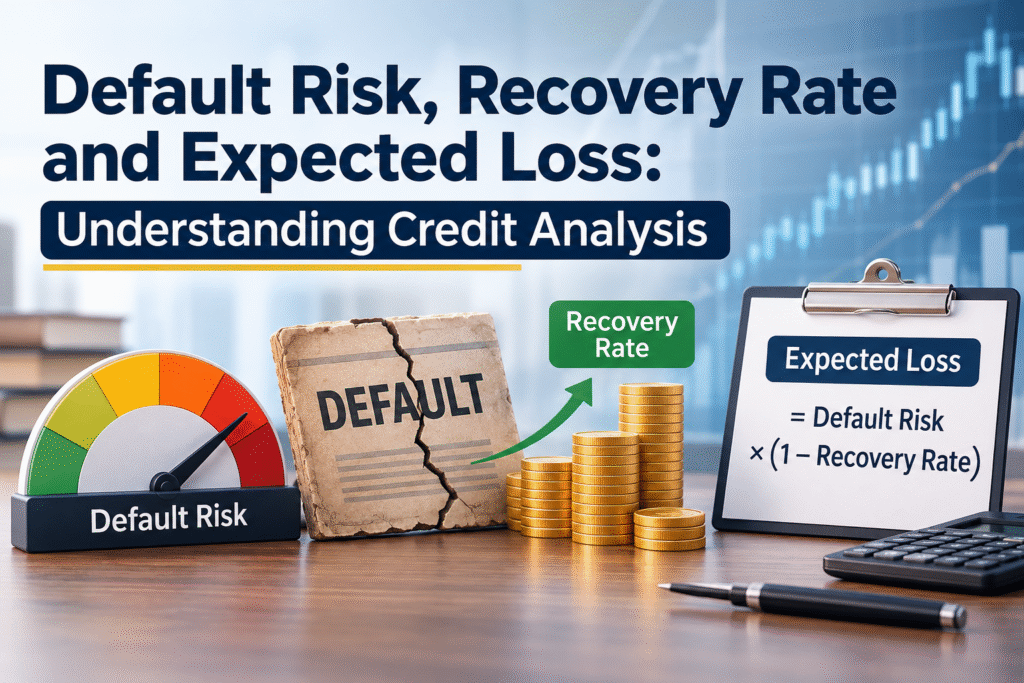
- Expected loss is the average loss a lender should plan for. Expected Loss = PD × LGD × Exposure at Default (EAD).
Keep this formula in mind. The rest of the article builds on it.
What Is Default Risk?
Default risk, also called credit risk or credit default risk, is the possibility that a borrower will miss a payment or fail to repay the loan in full. It applies to companies, banks, NBFCs, state governments, and individual borrowers.
Not every default is a total collapse. A company may be late by a few days, restructure its loan, or stop paying altogether. Rating agencies use a strict test. CRISIL treats any missed payment on a rated instrument as a default, and the rating moves to “D” once a debt obligation is not paid in full by the due date.
How Is Default Risk Measured?
The most common measure is the probability of default, usually stated for one year. A 1% PD means that, on average, one in every hundred similar borrowers is expected to default within twelve months.
Investors in India usually meet this idea through credit ratings from CRISIL, ICRA, CARE Ratings and India Ratings. A rating such as AAA, AA or BBB is a ranking of default risk. Higher ratings carry lower default probabilities.
Recent Indian data shows why the ranking matters. ICRA reported that its default rate stayed low at 0.4% in FY26, while India Ratings reported that defaults edged up from 0.6% to 0.8%. The two figures differ because each agency rates a different set of companies. CRISIL also found that “A” rated companies had a one-year default rate of only 0.07% over fiscals 2015 to 2025, which is better than many investors expect from a mid-rated bond.
Another useful signal is the credit ratio, which compares rating upgrades with downgrades. CRISIL’s credit ratio for India Inc moderated to 1.50 in the second half of FY26 from 2.17 in the first half, though about 82% of ratings were simply reaffirmed. This tells you that credit quality was still broadly stable, but the direction of travel had turned a little less friendly.
One limit to remember is that a rating speaks about the likelihood of timely repayment. It does not tell you how much you will get back after a default. For that, you need the recovery rate.
What Is Recovery Rate?
Recovery rate is the percentage of the outstanding amount that lenders actually get back after a borrower defaults. If a company owes ₹100 crore and creditors recover ₹30 crore, the recovery rate is 30%.
The opposite figure is the haircut, which is the part creditors lose. In that example, the haircut is 70%. Recovery rate and haircut always add up to 100%.
Why Recovery Rates Differ So Much
Recovery depends on several things:
- Seniority. Senior secured lenders get paid before unsecured lenders and shareholders.
- Collateral. A loan backed by land, plant or receivables usually recovers more than an unsecured one.
- Industry. Asset-heavy businesses often recover more than businesses whose value sits in people or brands.
- Time taken. A recovery that arrives after three years is worth less than the same rupees received in six months.
- Legal process. Court delays and procedural hurdles reduce what is left.
What Do Indian Recovery Rates Look Like?
India’s Insolvency and Bankruptcy Code (IBC) gives the clearest public data on recoveries. According to figures reported through June 2026, creditors have realised about ₹4.35 lakh crore against admitted claims of about ₹14.27 lakh crore. That works out to a recovery rate of roughly 30.5% and an average haircut of about 69.5%.
Recovery looks far better when measured against liquidation value. Creditors recovered about 166.6% of liquidation value, which means a going concern resolution paid much more than a forced sale of the assets would have.
Both statements are true at the same time. Admitted claims often include years of accumulated interest, so the headline percentage can look weak even when the underlying assets were worth only a fraction of the loan. Government data also shows that around 30.5% of closed cases saw haircuts above 90%.
Time is a further cost. India Ratings reported that the average resolution under IBC took about 751 days for financial creditors in FY26, the longest since FY21. For a lender, a long wait reduces the real value of whatever is eventually recovered.
The lesson for an investor is simple. In India, the average recovery after a corporate default is low, and any credit analysis that assumes you will get most of your money back is probably too hopeful.
What Is Expected Loss?
Expected loss is the amount a lender should expect to lose, on average, from lending to a borrower over a given period. It brings default risk and recovery rate into one number.
Expected Loss (EL) = PD × LGD × EAD
- PD is the probability of default.
- LGD is loss given default, which equals 1 minus the recovery rate.
- EAD is exposure at default, meaning the amount outstanding when the default happens.
Worked Example in Rupees
Suppose you invest ₹10,00,000 in an unsecured NCD of a mid-sized company. Your analysis gives these assumptions, which are illustrative and not forecasts:
- Probability of default over one year: 2%
- Recovery rate: 30%, so LGD is 70%
- Exposure at default: ₹10,00,000
Expected loss = 0.02 × 0.70 × ₹10,00,000 = ₹14,000
That is 1.4% of your investment. If the NCD pays 10% interest and your expected credit loss is 1.4% a year, the interest left after allowing for credit loss is about 8.6%. This is not a guaranteed return. It is a more honest starting point for comparison than the coupon alone.
Expected Loss Is an Average, Not a Prediction
Expected loss does not say you will lose ₹14,000. In most years, a healthy borrower pays everything and you lose nothing. In an unlucky year, the borrower defaults and you lose ₹7,00,000. The ₹14,000 is the average across many similar loans. This is why lenders spread their money across many borrowers, and why a single concentrated bet is riskier than the formula suggests.
Default Risk, Recovery Rate and Expected Loss at a Glance
| Term | Meaning | Simple example |
|---|---|---|
| Probability of default (PD) | Chance the borrower fails to pay | 2% in one year |
| Recovery rate | Share recovered after default | 30% |
| Loss given default (LGD) | Share lost after default | 70% |
| Exposure at default (EAD) | Amount owed at the time of default | ₹10,00,000 |
| Expected loss (EL) | PD × LGD × EAD | ₹14,000 |
| Credit spread | Extra yield over a risk-free bond | 3.7% |
How Expected Loss Connects to Credit Spreads
A credit spread is the extra yield a corporate bond pays over a government security of similar maturity. Part of the spread pays you for expected loss. The rest pays you for liquidity risk and for the uncertainty around your estimates.
Here is a hypothetical comparison:
| Bond A (high quality) | Bond B (lower quality) | |
|---|---|---|
| Yield | 7.8% | 11.5% |
| Probability of default | 0.1% | 3.0% |
| Recovery rate | 40% | 25% |
| LGD | 60% | 75% |
| Expected loss | 0.06% | 2.25% |
Bond B pays 3.7 percentage points more than Bond A. Of that gap, about 2.19 percentage points is expected loss (2.25% minus 0.06%). Only about 1.51 percentage points is left as compensation for taking the extra risk. If you had looked only at the 11.5% yield, Bond B would have looked far more attractive than it is.
How Credit Analysis Works in Practice
Credit analysis is the work of estimating how likely a borrower is to repay, and how much you would recover if it does not. A sensible analysis looks at both the numbers and the situation behind them.
The 5 Cs of Credit
Lenders often organise their review around five points:
- Character. The borrower’s repayment history and the integrity of the promoters.
- Capacity. Whether cash flows are enough to service the debt.
- Capital. How much of the business is funded by owners rather than lenders.
- Collateral. What assets back the loan, and what they would fetch in a sale.
- Conditions. The state of the industry, interest rates and the economy.
Ratios Worth Checking
- Interest coverage ratio (EBIT divided by interest expense). A low figure means little room for error. Many analysts become cautious when it falls below about 2 times.
- Debt service coverage ratio (cash available for debt service divided by total debt payments due). Banks commonly look for comfortably more than 1.
- Debt to EBITDA. This shows how many years of operating profit it would take to repay the debt.
- Debt to equity. A high ratio means the lenders carry more of the risk than the owners.
- Cash flow from operations. Profit on paper means little if cash does not arrive.
No single ratio decides the matter. A company with a high debt to EBITDA may still be a safe borrower if its cash flows are steady and its assets are valuable.
Qualitative Checks
Read the rating rationale, the auditor’s notes, and the list of related party transactions. Look at how much of the debt is due in the next twelve to eighteen months, and whether the company has cash or undrawn limits to meet it. Promoter pledging of shares, delayed filings and sudden changes in auditors are warning signs.
Where Indian Investors Meet These Ideas
Corporate Bonds and NCDs
Every NCD offer document includes a rating and a rationale. Treat the rating as the starting point for default risk, then ask about security. A secured NCD with a first charge on assets should recover more than an unsecured one, although the legal process can still be slow.
Credit Risk Funds
SEBI’s fund categories require credit risk funds to invest at least 65% of their assets in corporate bonds rated AA and below. These funds deliberately take more default risk to earn a higher yield. A single default can cut the net asset value sharply and in one day. The Franklin Templeton episode in 2020, when six debt schemes were wound up after a liquidity and credit squeeze, is a reminder of how this can unfold.
Additional Tier 1 Bonds
In 2020, the write-down of Yes Bank’s AT1 bonds showed that a bond can lose its full value without a classic bankruptcy. Recovery was zero for those holders. Complex bank bonds carry a different type of default risk, and the high coupon reflects it.
How Banks and NBFCs Use Expected Loss
Indian lenders that follow Ind AS 109 provide for expected credit losses (ECL) using the same building blocks you saw above: PD, LGD and EAD. This is an accounting rule that forces lenders to recognise likely losses earlier. It is also a useful model for your own thinking.
Common Mistakes in Credit Analysis
- Relying on yield alone. A high coupon is often the market’s way of pricing a higher expected loss.
- Treating the rating as permanent. Ratings change. A downgrade can hurt the price of the bond long before any default.
- Assuming high recovery. Indian data shows an average recovery near 30% of admitted claims after insolvency.
- Ignoring time. A recovery after two years is worth less than a recovery after two months.
- Concentrating in one issuer. The expected loss formula works on averages. One bad outcome on a large position is not an average.
- Confusing a rating with recovery. A rating speaks about the chance of timely payment and does not forecast recovery.
A Simple Checklist Before You Lend
- Check the rating and the rating rationale from at least one agency.
- Estimate a reasonable probability of default for that rating.
- Assume a recovery rate that matches the security and seniority of the instrument, and be cautious.
- Calculate expected loss using PD × LGD × EAD.
- Compare the yield with a government security of similar maturity and see how much of the spread is left after expected loss.
- Limit the size of any single position.
Frequently Asked Questions
What is default risk in simple words?
Default risk is the chance that a borrower will not repay the money it owes on time. It applies to companies, banks, governments and individuals.
What is the difference between default risk and credit risk?
Credit risk is the wider term. It covers the risk of default and also the risk that a borrower’s credit quality falls, which can reduce the market price of its bonds. Default risk is the part about actual non-payment.
What is a good recovery rate?
There is no single answer. Secured senior debt in good market conditions can recover a large share of what is owed, while unsecured debt in a stressed sale may recover very little. Under India’s IBC, creditors have recovered about 30.5% of admitted claims overall, so investors should be careful about assuming high recovery.
How do you calculate expected loss?
Multiply the probability of default by the loss given default and by the exposure at default. For example, 2% × 70% × ₹10,00,000 gives an expected loss of ₹14,000.
What is loss given default?
Loss given default is the share of the exposure that a lender loses after a default. It equals 1 minus the recovery rate. A recovery rate of 30% means an LGD of 70%.
Does a higher credit rating mean a higher recovery rate?
Not directly. A rating reflects the chance of timely repayment. Recovery depends on security, seniority, the borrower’s assets and the legal process.
Is expected loss the same as the actual loss I will suffer?
No. Expected loss is a statistical average. In any single year you may lose nothing, or you may lose a large part of your investment.
How can a retail investor reduce default risk?
Prefer higher rated and secured instruments, spread money across several issuers, avoid putting too much into one NCD or one credit risk fund, and compare yield with expected loss rather than looking at the coupon alone.
Conclusion
Default risk tells you how likely a borrower is to fail. Recovery rate tells you how much you could get back if it does. Expected loss joins the two into a figure you can compare with the yield on offer. Once you see credit this way, a high coupon stops being an invitation and becomes a price that needs a closer look.
Run the numbers before you lend, keep your positions small, and remember that in India the road from default to recovery is long and often disappointing.
Disclaimer: This article is for education only and is not investment advice. The worked examples use assumed figures. Check current ratings and offer documents, and consult a SEBI registered investment adviser before investing.
Be Part of Something Bigger!
Whether you’re exploring new ideas, learning something new, or looking for opportunities, Enigma Community brings you closer to a world of possibilities.
Join Us: https://www.enigmacommunity.com/